Thursday, September 19, 2013

Middle East History - Visual Quick Study

  - Note: Click on any map to enlarge it - 

Ancient History (B.C.)

Fertile Crescent

The Earliest Civilizations

3500 BC

Mesopotamia: First States and Writing

Bronze Age - 1400 BC

1450 B.C.
Fall of the Assyrian Empire
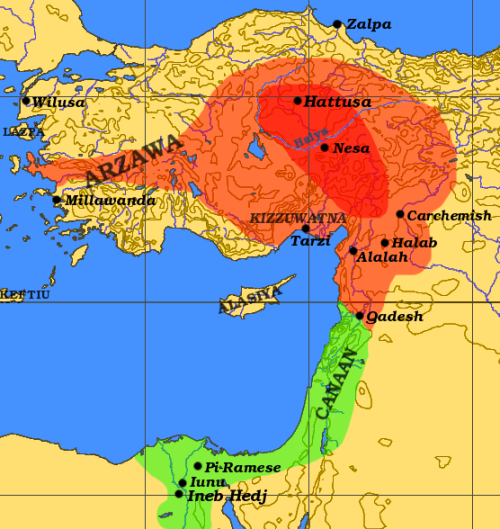
Egyptian and Hittite Empires 1290 BC 
 
Babylonian Empire 560 B.C.

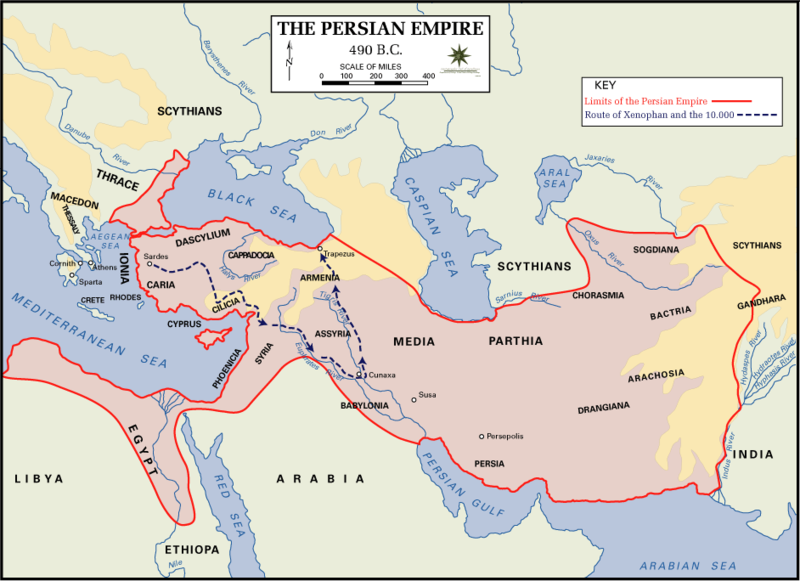
The Persian Empire - 490 B.C.
The Persian Empire - 500 BC
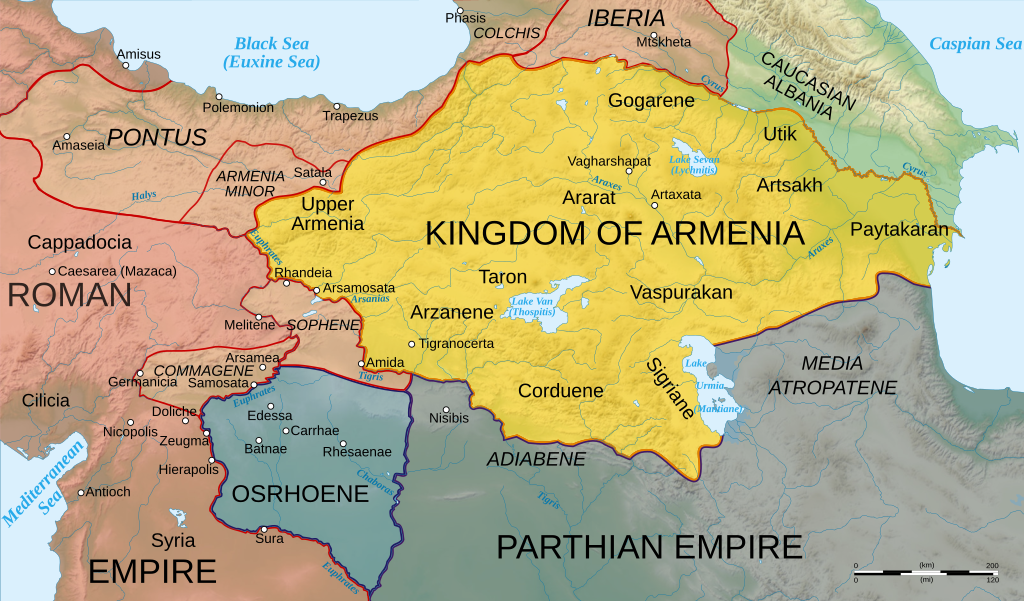
Armenia - 50 AD

For Further Details


Roman Influence (A.D.)

Roman Empire - 200 AD
Roman Empire Divided - 450 AD
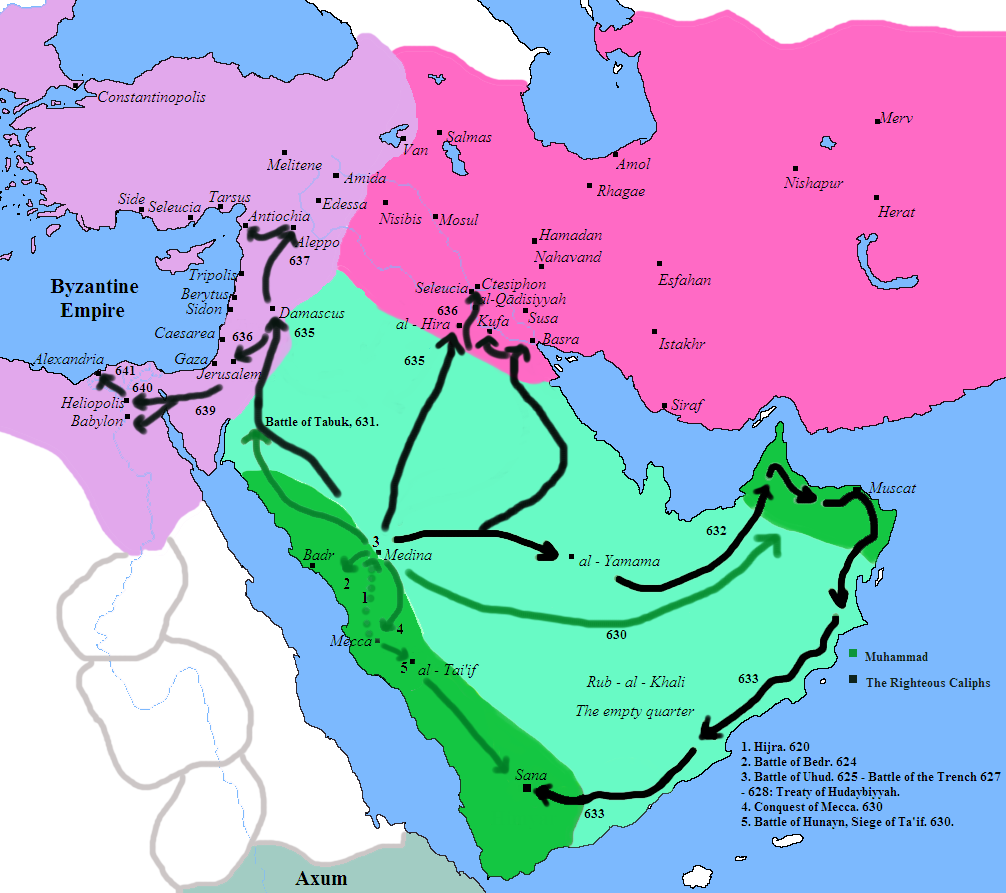

The Rise of Islam

Islamic Conquests 620 A.D. - 750 A.D.


Continual Turmoil

Byzantine, Seljuk Turks, Mongol and Crusader Influence
Byzantine Empire 1000-1100

The Seljuk Turks 1100
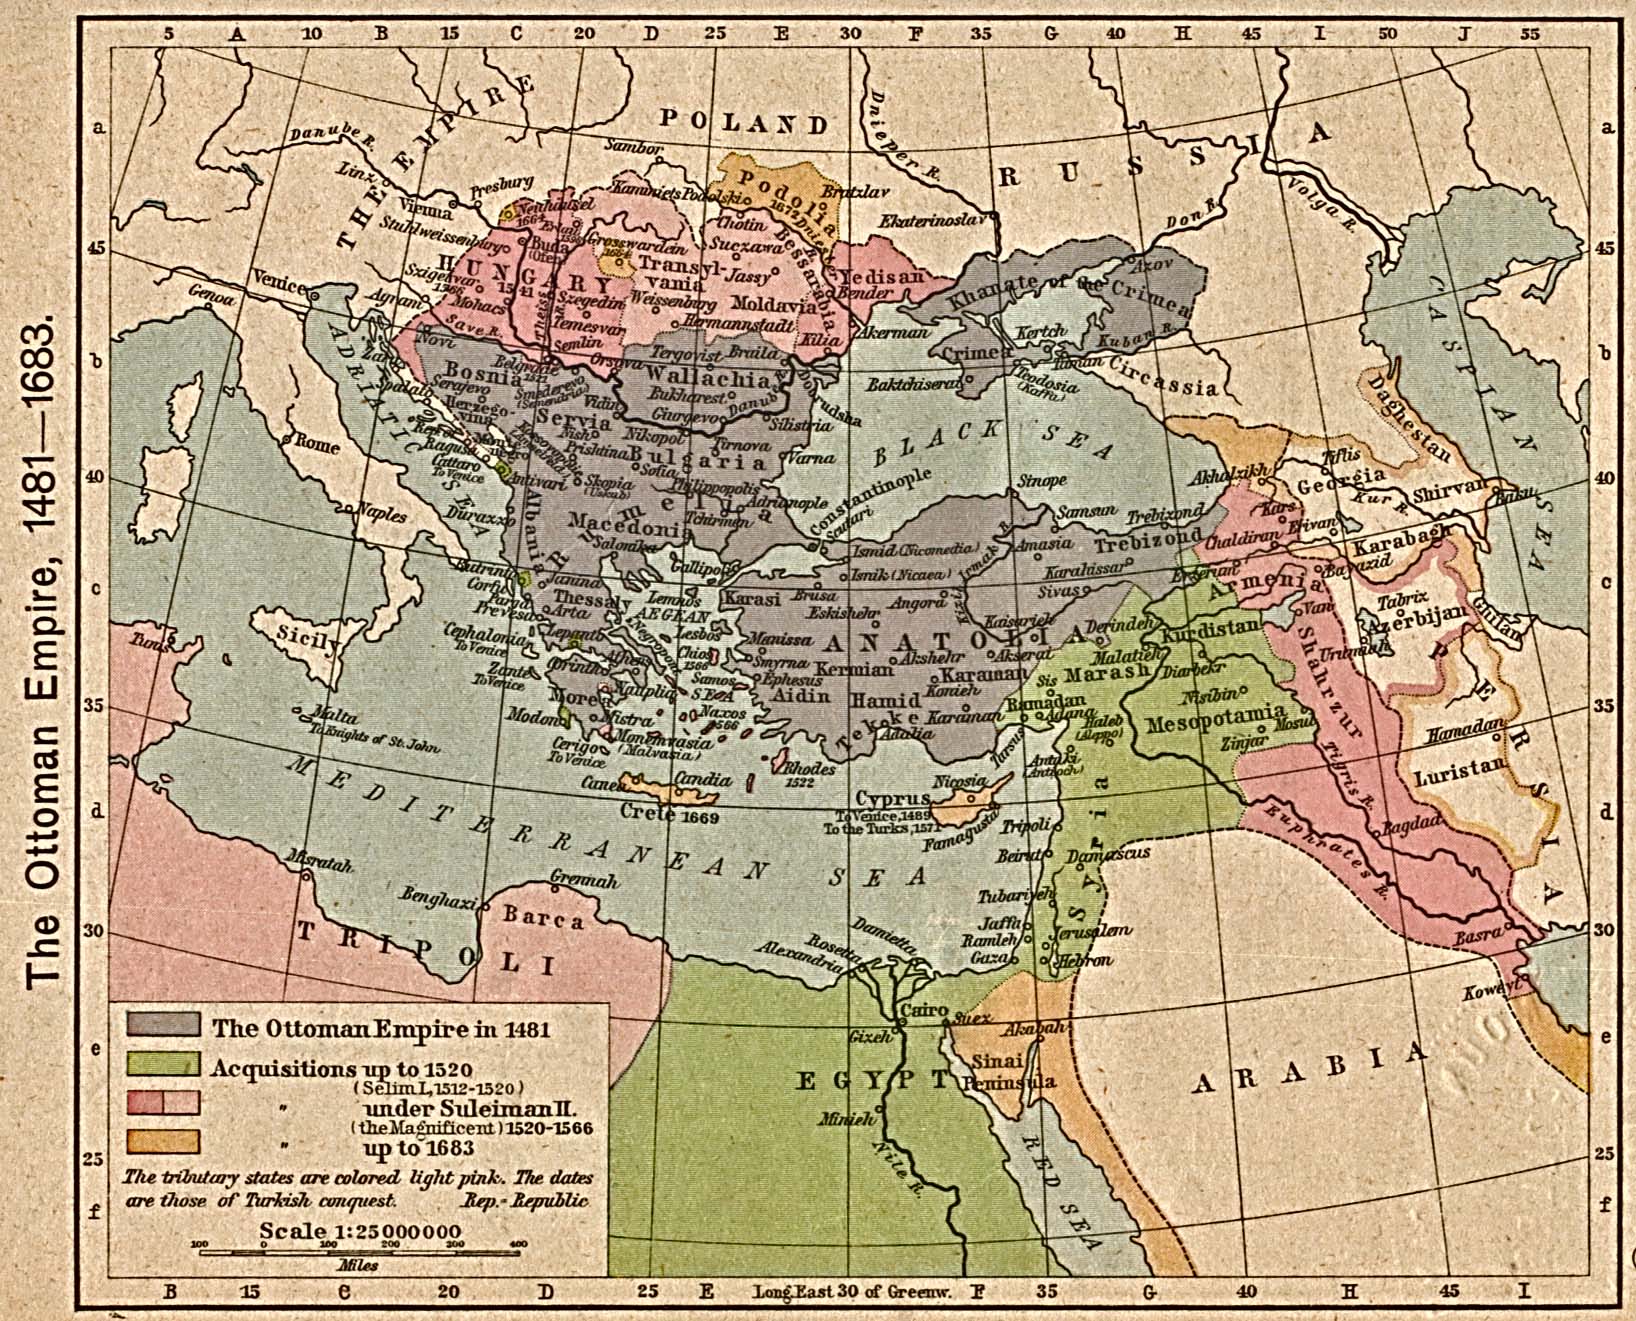
The Crusades 1096 - 1270
 
Mongol Empire - 1294


Ottoman Influence

1841- Ottoman Empire

1914 - Ottoman Empire


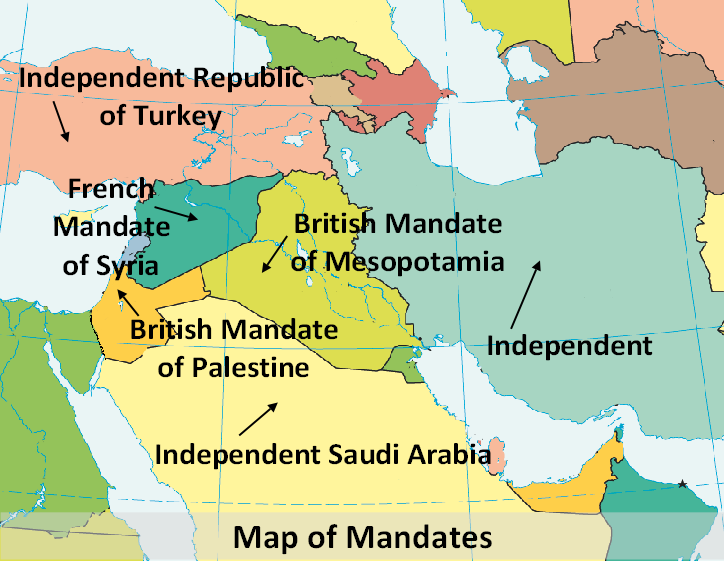
Post World War 1 - European Partitioning

1916 - The Sykes-Picot Agreement

1922 - Partitioning of the Ottoman Empire 

1940


Religions

1982 - Shiite Population

Distribution of Religions (Modern Day - Mediterranean and Middle East)


Further Study - Map Collections, etc.

TimeMaps > 
Great Chronological Succession of Maps, Timeline Based

Middle East Maps > 
Extensive Map Library


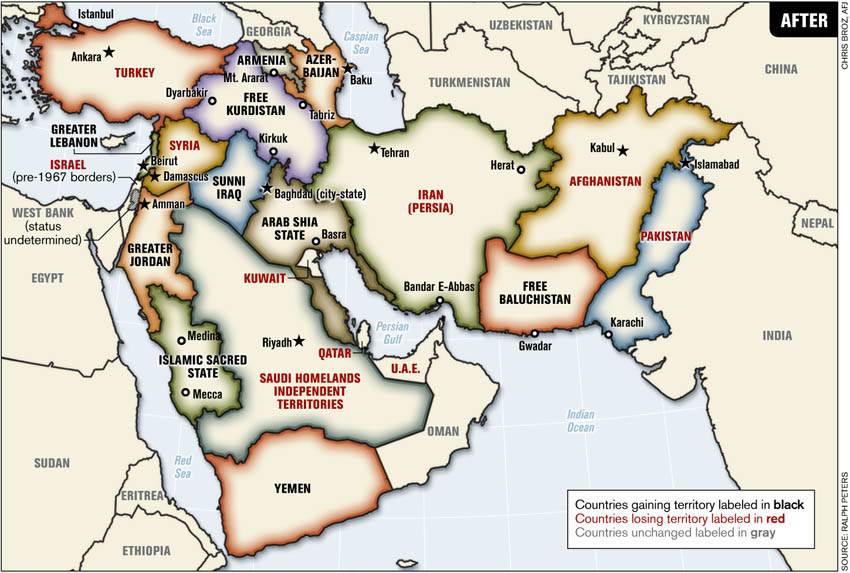
and finally… Conjecture for the Future


Wednesday, September 18, 2013

Monday, September 9, 2013

Languages in the United States (Map)


A Map of Languages in the United States
The MLA Language Map is a free resource from 
the Modern Language Association that gives detailed information 
about linguistic diversity in the United States


Click on the View the Map link
Select Prevalent Language Other Than English maps 
to see the most spoken language in each county

Saturday, September 7, 2013

U.S. Language Mapper Tool


2011 Language Mapper Tool - U.S Census Bureau


This highly interactive map does a good job of showing 
where non-english languages prevail through out the U.S.A.


Map Visualizations are based on this data >

Thursday, September 5, 2013

The Measure of America - Interactive Map


The Measure of America 2013–2014

"In the era of “big data,” it would seem that policymakers and regular people alike would have the information they need at their fingertips to understand their world and make it better. Unfortunately, that’s far from the case. Though we know the country’s gross domestic product quarterly, its retail sales monthly, and stock market numbers minute-by-minute, we rarely hear statistics on our country’s people.
How long can a baby born today in Missouri, New Mexico, or Minnesota expect to live? What proportion of adults have completed high school in Houston as compared to Dallas? What wages and salaries are typical of Latinos in the United States, and how do they compare to those of whites or African Americans?"
Measure of America
- A Project of the Social Science Research Council


The Measure of America 2013–2014

Chock full of infographics and interactive maps, this site is a project of the Social Science Research Council. Its mission is to use data points to measure American's well-being and access to opportunity. The third volume in the Measure of America series measures well-being in three vital areas—health, education, and earnings.

Interactive Map

Ever wondered how your state or congressional district stacks up compared with your neighbors on life expectancy, preschool enrollment, earnings or dozens of other indicators?  Create customized maps >


Tuesday, September 3, 2013

Earth Pulse - Vital Statistics


Vital Statistics 

Map and compare global trends -


Check this one out - it is pretty amazing!
Population, Resources, Deforestation, Political Migration and More...
Map and compare global trends.