Showing posts with label Energy. Show all posts

Friday, July 5, 2019

Churchill Falls - hydroelectric power station


Churchill Falls hydropower

The machine hall of the power facility at Churchill Falls was hollowed out of solid rock, close to 1,000 ft (300 m) underground. Its final proportions are huge: in height it equals a 15-story building, its length is three times that of a football field. At the time, the project was the largest civil engineering project ever undertaken in North America.
Churchill Falls, Labrador, ca. 1969
Churchill Falls - 2008
wow!


Google Aerial View of the area View >

Video

nice animated infographics!

Transmission Lines

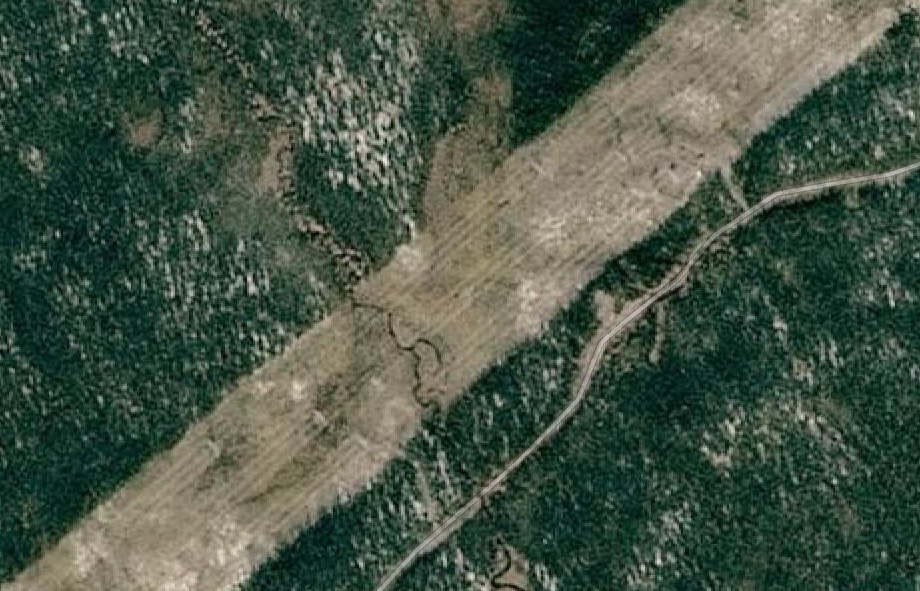
I first found about about Churchill Falls when a couple of years back I was panning a Google Map in Satellite view and noted this strange diagonal line all across Labrador. It was bizarre - what could it be? I traced it northward and found the Town and hydroelectric plant and became fascinated.

Google Street View of the huge swath of the  transmission lines
View >
Google Close Up Aerial View
View >
The red line indicates the transmission lines wide swath across Labrador


Thursday, March 2, 2017

A World of Oil

GSM London have created an amazing interactive map to show oil imports and exports that spans the last 15 years.
Screenshot

Interactive Map >

Saturday, September 12, 2015

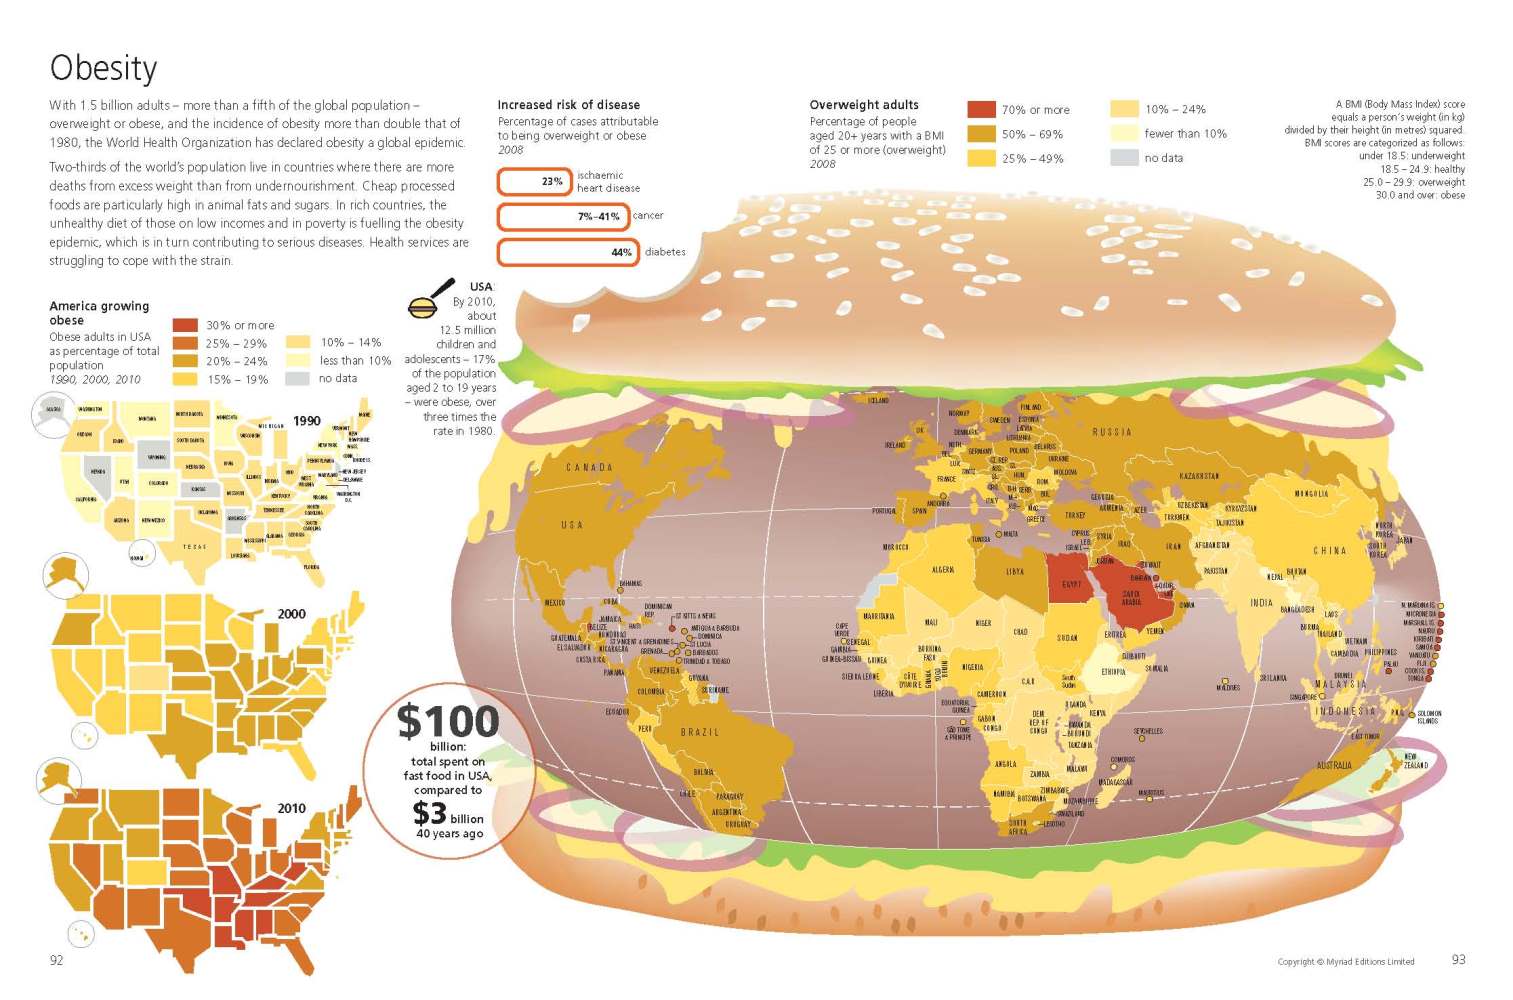
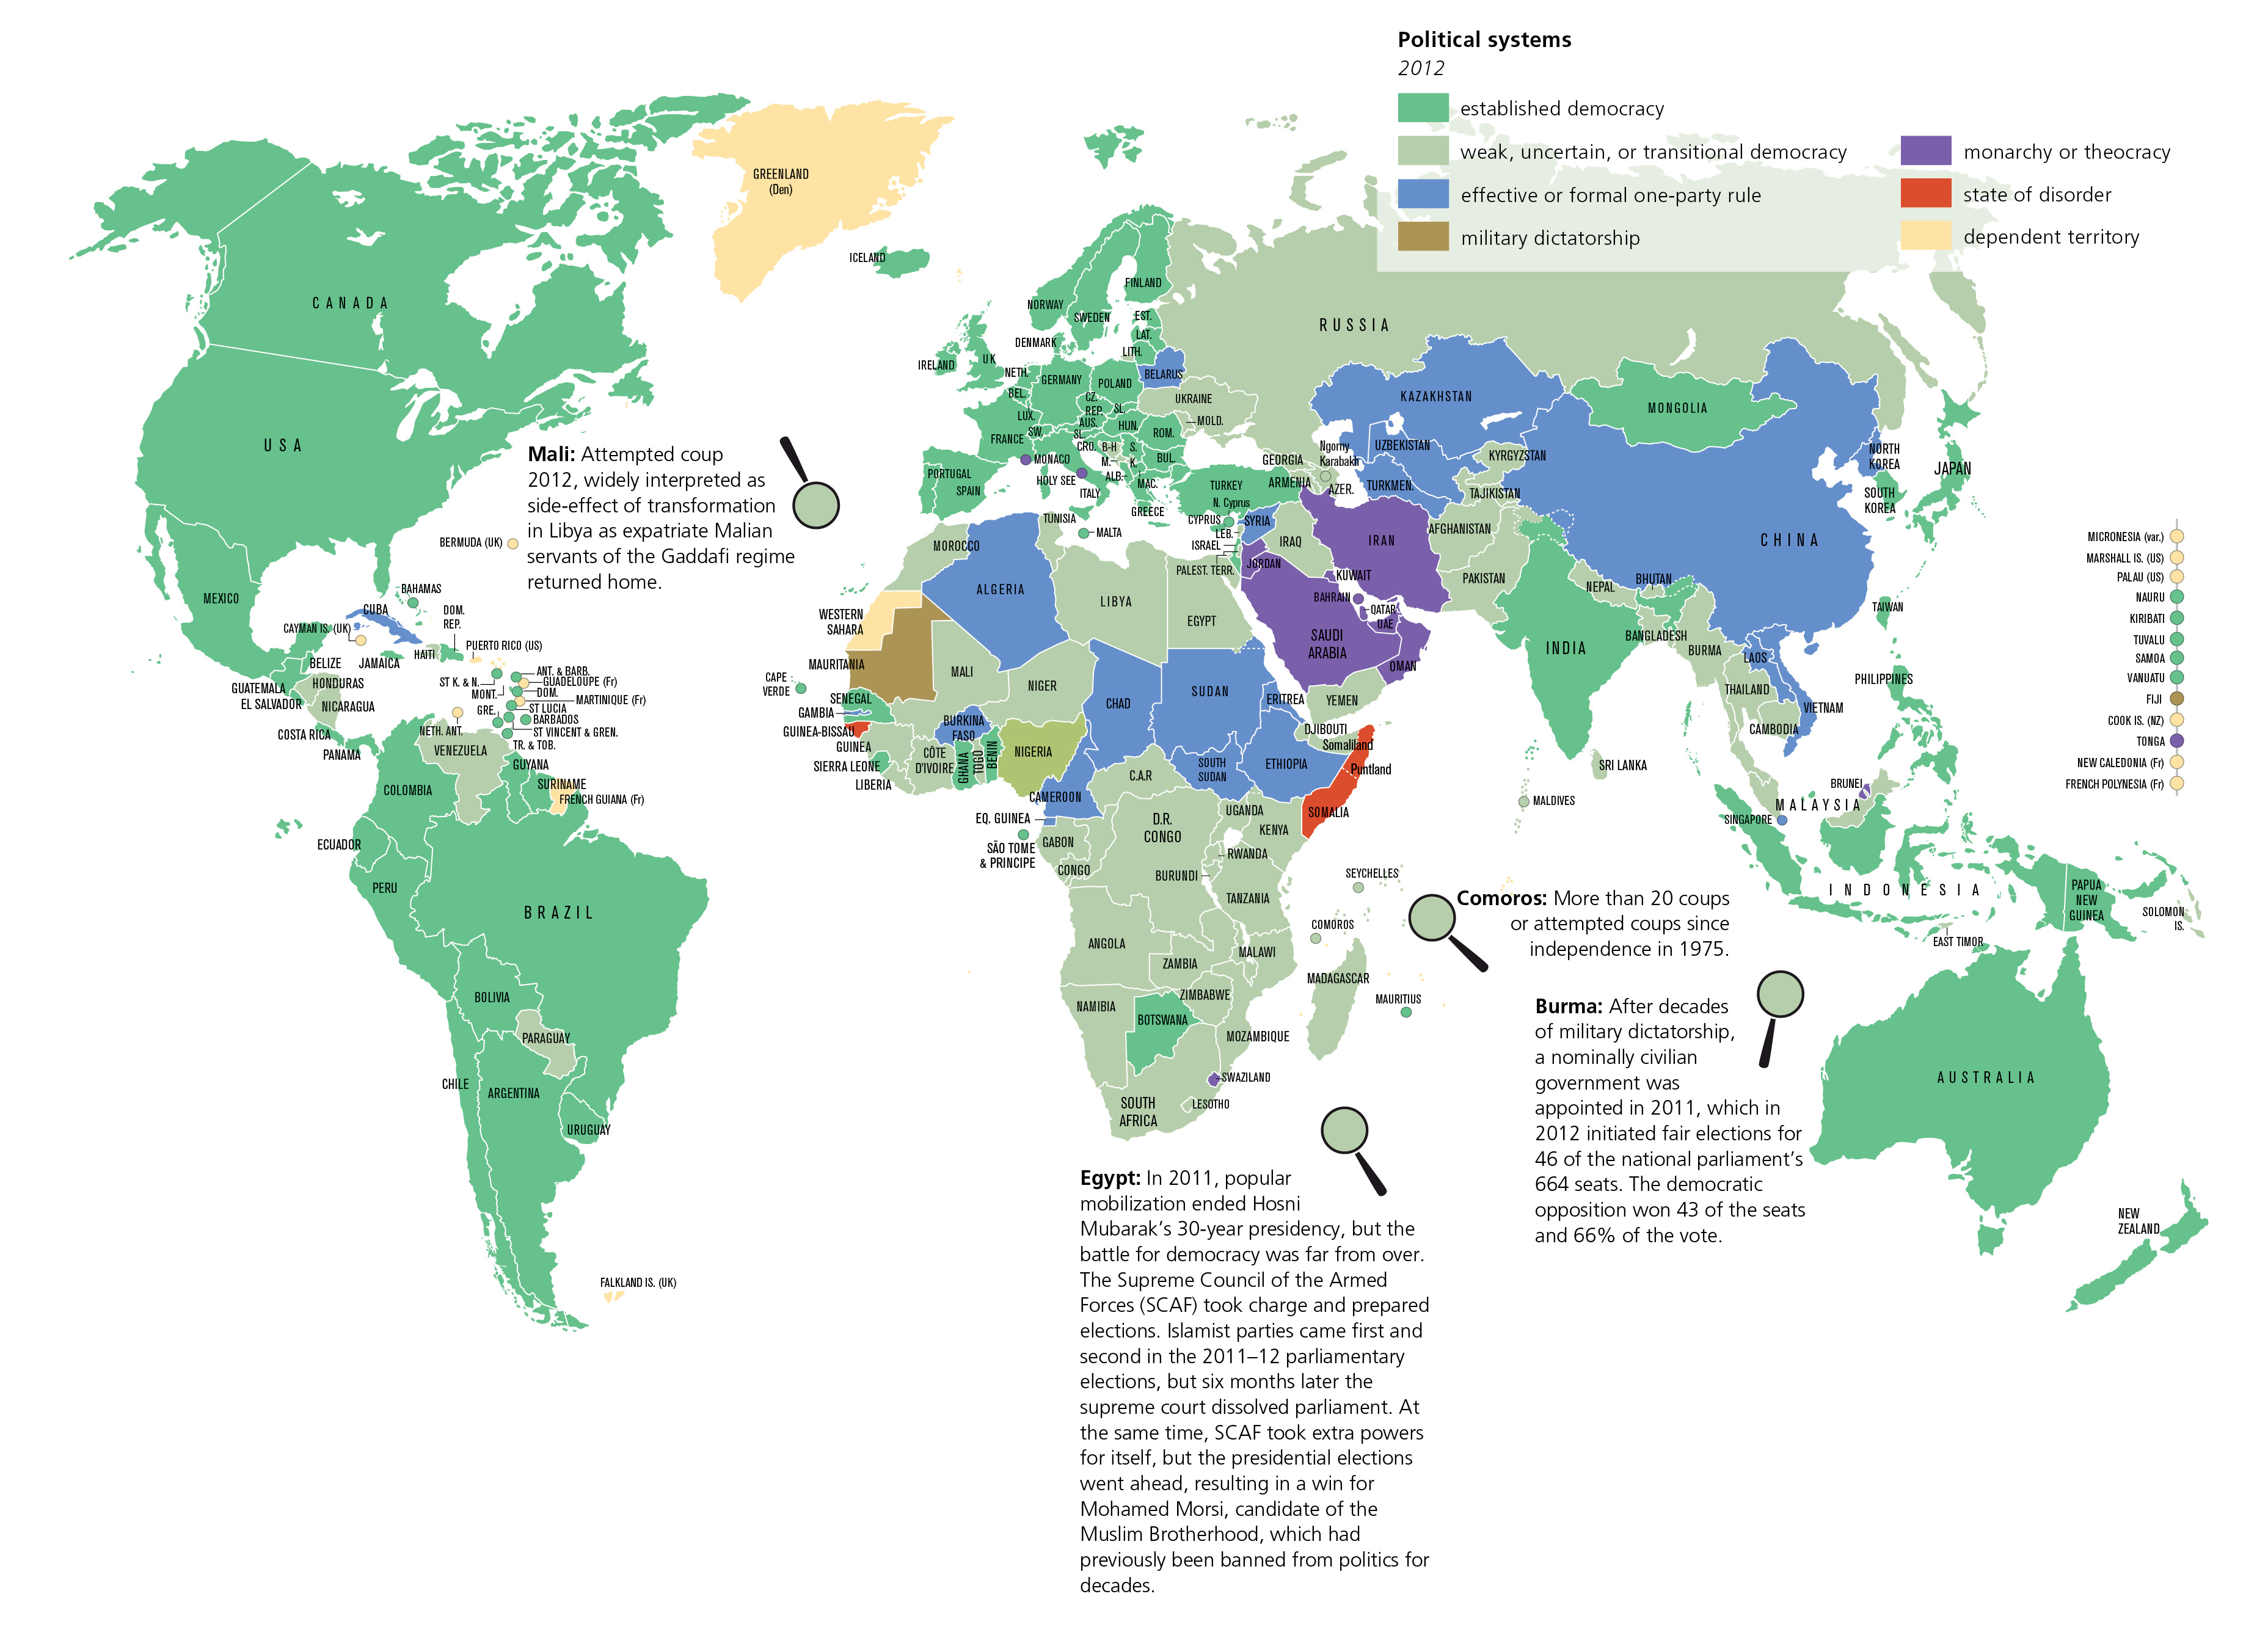
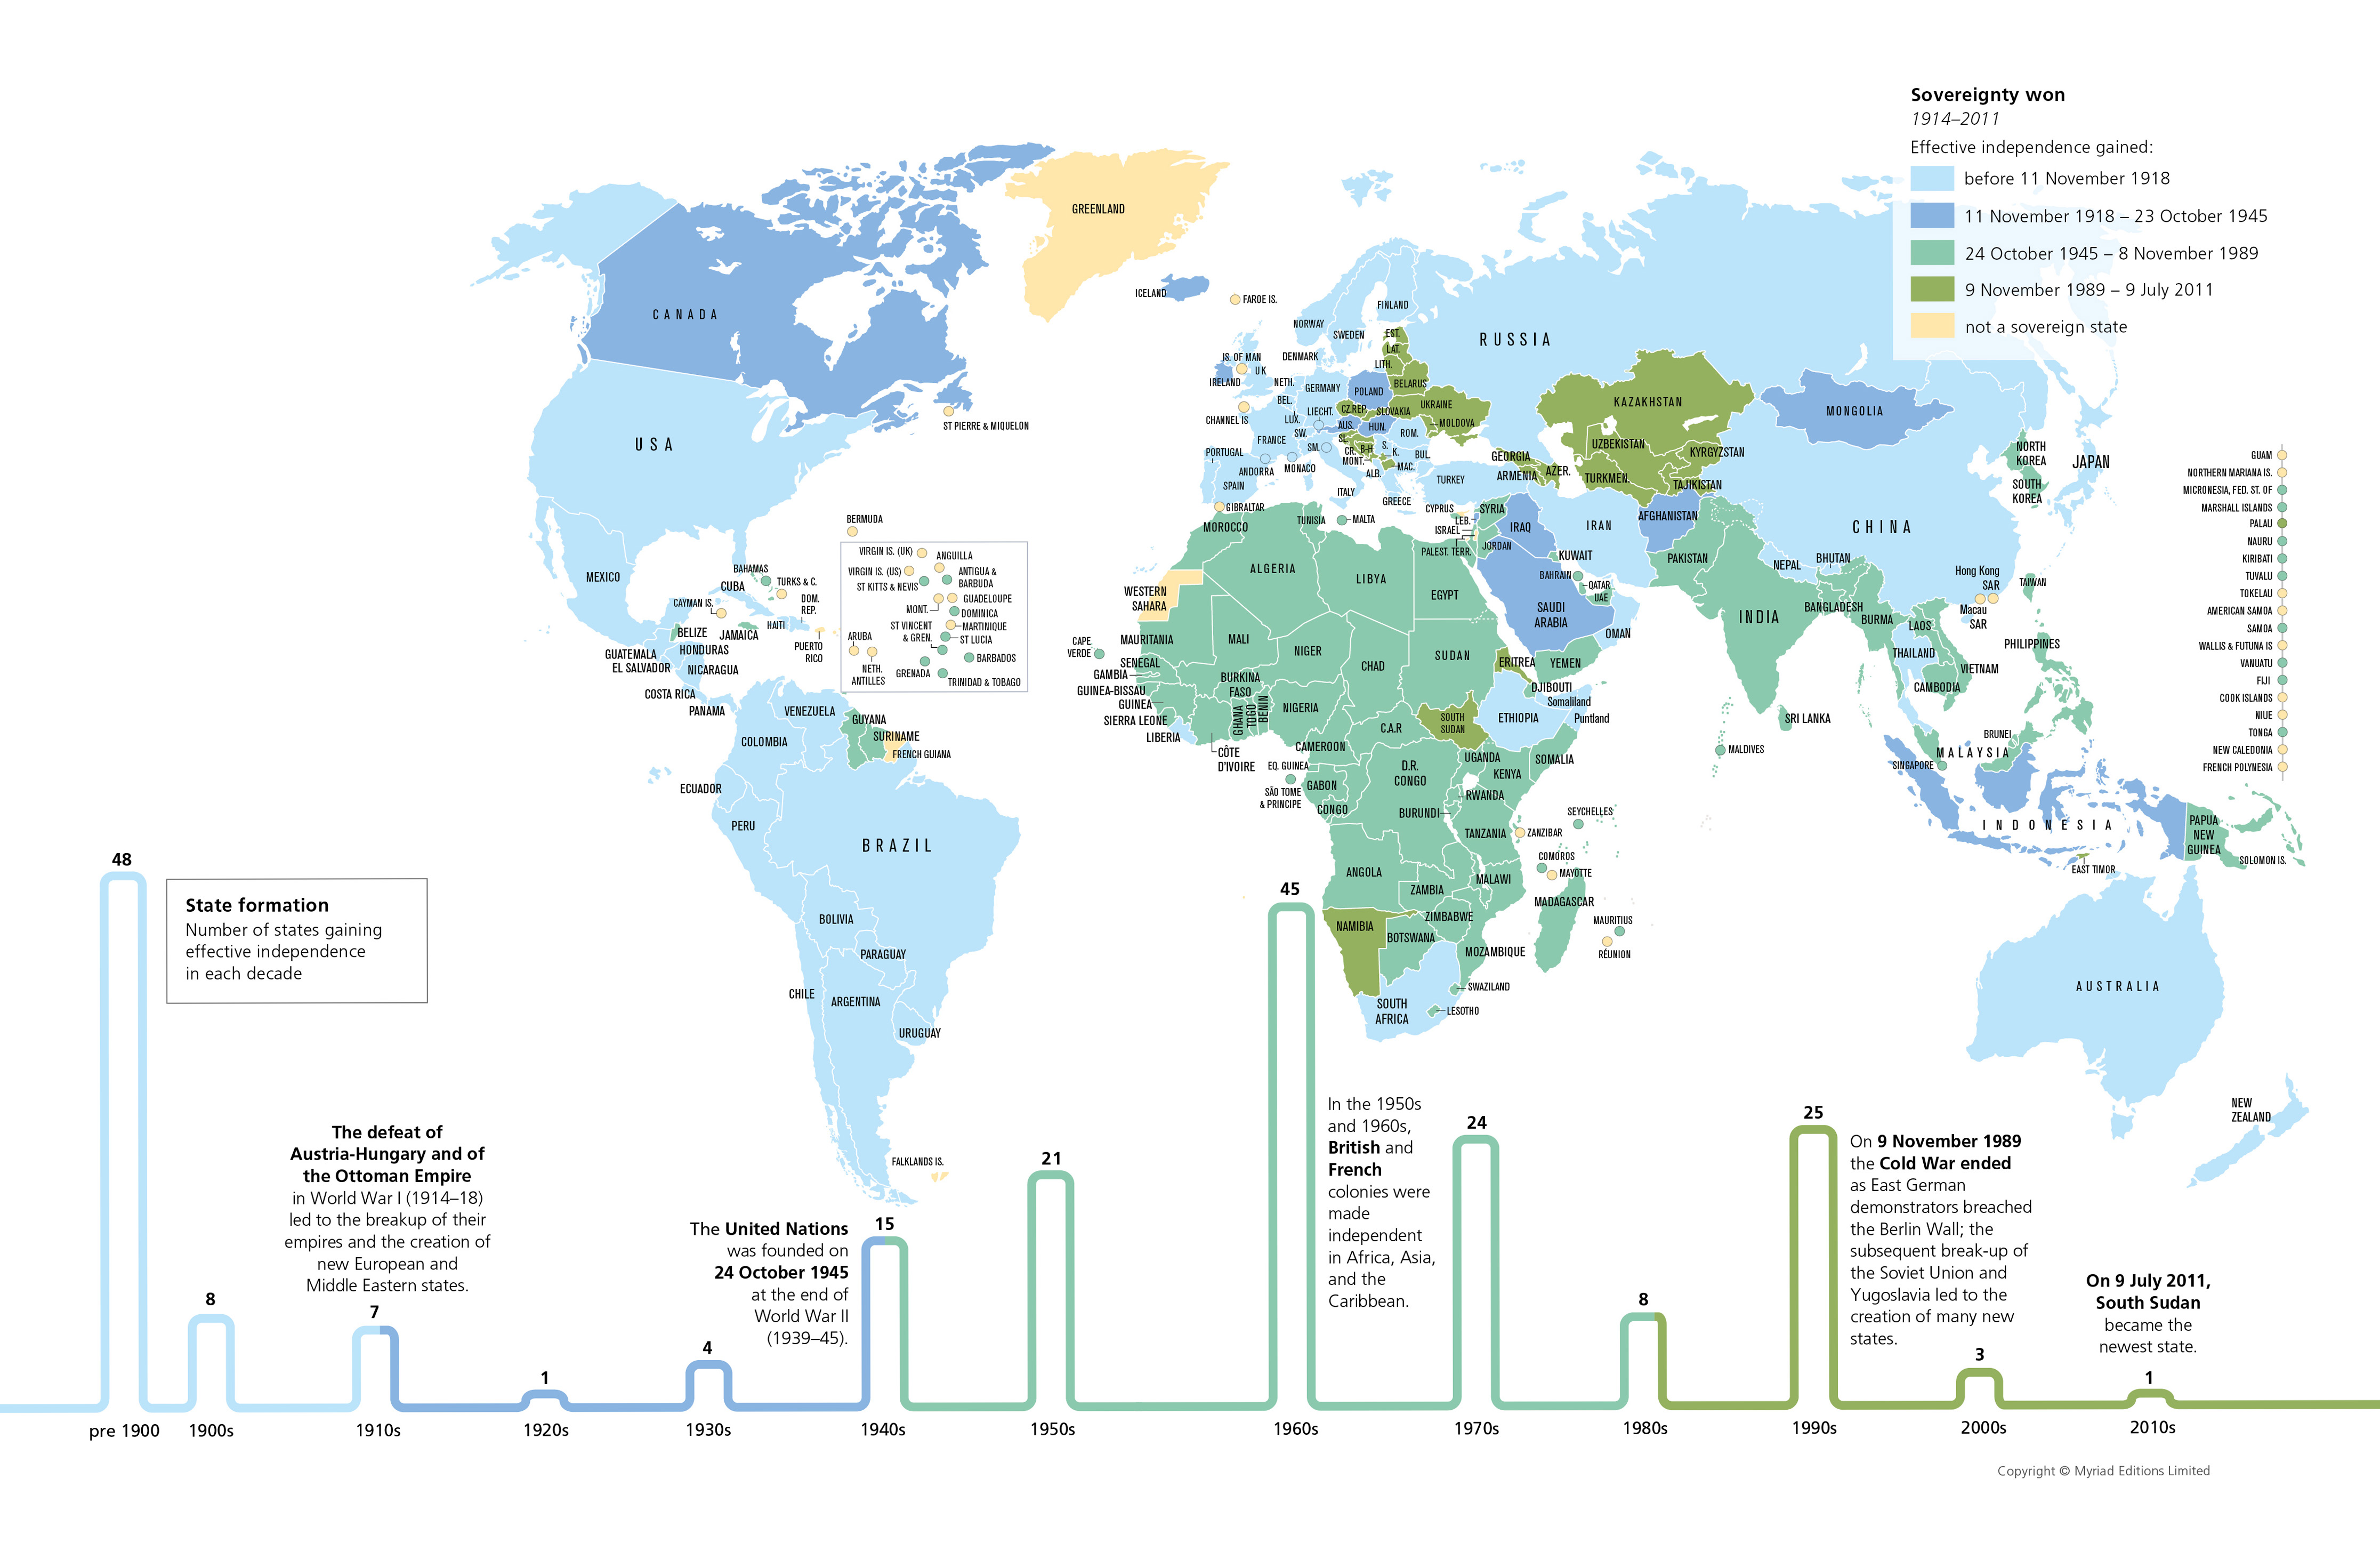
State of the World (Myriad Editions)

I took this book/atlas out of the library near where I work. Highly recommended, it is very nicely done...

The State of the World Atlas, was originally devised by Michael Kidron and Ronald Segal and is now authored by leading international peace researcher Dan Smith, OBE. It has sold more than 700,000 copies worldwide.  (Myriad Editions-  Penguin Books)

Over 50-plus thematic world maps and vivid graphics break down hardcore statistics into an accessible, compelling form. A unique visual overview of current events and global trends.
Atlas Book Cover


EXAMPLES


As used in blogs...


Sunday, March 22, 2015

Monday, January 5, 2015

The Real Reason U.S. Gas Is So Cheap

American fuel prices are kept down artificially by low gas taxes that fail to address the true social cost of driving. This national refusal to increase gas taxes—which have gone unchanged at the federal level since 1993. Most first-world countries paid at least double what America did then, just as they do today.


This “budget gap” has two enormous impacts on everyday life. The first is that drivers no longer cover the cost of road and bridge maintenance, as the gas tax originally intended.

The far bigger problem is that America's gas taxes are too low to offset what economists call the "externalities" of driving these are the negative social impacts that aren't being compensated for: personal time and work productivity lost to traffic congestion, lives lost to car crashes, health risks created by air pollution, etc.

Article >


Thursday, December 11, 2014

Geostrategy: Oil Pipeline Maps

Much of the conflicts and future conflicts in the world today increasingly are based on access and control of energy resources. Bolstering economic alliances between nations by securing safe transport of oil and natural gas using strategically located pipelines plays an enormous role in geopolitics today

Article >


Article >


Article >


Thursday, March 13, 2014

U.S. Energy Disruptions

Energy Disruptions - US Energy Information Administration


EIA tracks and reports on selected significant storms that impact or could potentially impact energy infrastructure. See past historical events reported on right or real-time storm tracking with energy infrastructure indicated.


Thursday, August 8, 2013

Climate-Related Power Outages


Rising temperatures will continue to put an ever-increasing strain 
on electricity resources.

Saturday, March 30, 2013

U.S Nuclear Power Risk Issues

If a nuclear power plant in the U.S. were to have issues, who would be affected? 


Risks from Flooding to Numerous U.S. Nuclear Facilities


Sunday, March 17, 2013

The Energy Curve of History

Looking at peak-oil in perspective: Ultimately, the energy-intensive industrial age we live in may be little more than a blip in the course of human history.