Saturday, December 12, 2020

Three Great Interactive Maps

A Few Great Interactive Maps...

With technology advancements, content on maps and the maps themselves became digital, interactive, and more appealing as they’re incorporated in data analysis and reporting. Seeing location data mapped and included in visualizations has both enhanced understanding by more audiences and offered a valuable, new context.

Below are three notable data-driven examples that demonstrate the power of location data when paired with business intelligence.

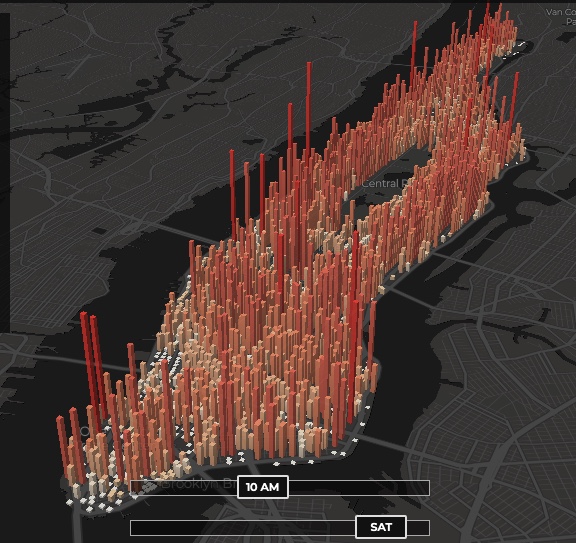
1 - The invisible heartbeat of New York City

Visualization by: Justin Fung. This is amazing (you may have to refresh the page)

http://manpopex.us/


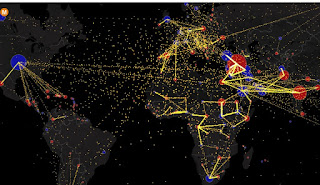
2 - All the World’s Immigration Visualized in One Map

Estimated net immigration (inflows minus outflows) by origin and destination country between 2010 and 2015.


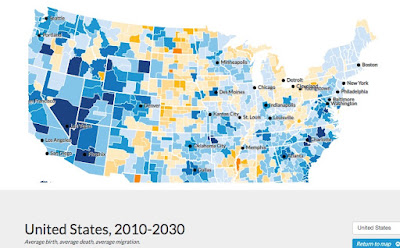
 3 - Mapping America’s Futures

This is a great example of a well made data-driven interactive map.

Test possible scenarios for how the US population might change by 2020 and 2030. The results will change depending on whether you choose low, average, or high rates for future births, deaths, or migration.

https://apps.urban.org/features/mapping-americas-futures/#map


Friday, December 11, 2020

Maps That Show Us A New Perspective

This is an interesting site! The blurbs with each map are short and well written as well....

Land Use Throughout The United States

Air Traffic Control Zones Look Nothing Like The Country

Metric System Vs. Imperial System

Texas Doesn't Look All That Big Next Compared To Africa

Maps That Show Us A New Perspective >


Saturday, December 5, 2020

Ghost Towns of the World

This a phenomenal site! Navigate across the world using a Google Map that links to a myriad of wb sites on ghost towns, etc.

Ghost Towns of the World


Map location links will take you to sites with photos such as these: