Showing posts with label pollution. Show all posts

Tuesday, March 22, 2016

The Tragedy of Drying Lakes

Quite a few lakes throughout the world are drying or completely dry due to water diversion caused by irrigation or overwhelming urban demands. Its a tragic situation often with dire and monumental consequences. Three of the lakes are detailed below.

Lake Urmia - Iran

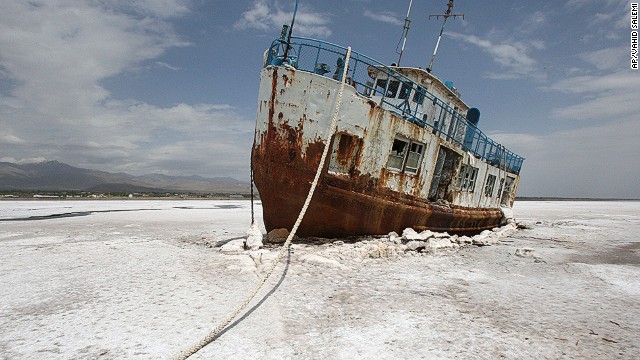
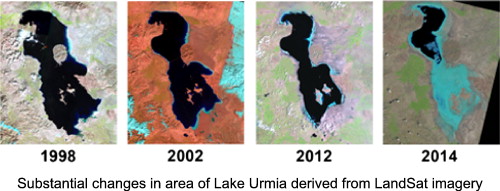
Lake Urmia is a drying salt lake near Iran's border with Turkey. At its former peak size, it was the largest lake in the Middle East and the sixth largest saltwater lake on earth.  The lake has shrunk to 10% of its former size since 1970 due to damming of the rivers that flow into it and pumping of groundwater from the area. Becase of its high salinity, the lake no longer sustains any fish species.
Aral Sea - Russia, 

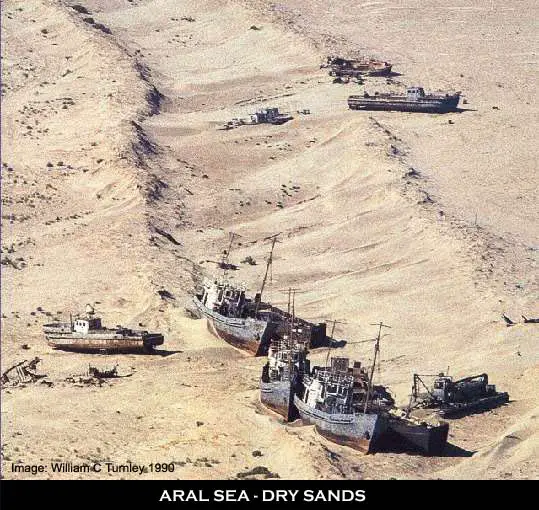
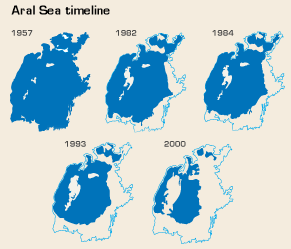
Formerly one of the four largest lakes in the world with an area of 26,300 sq mi, the Aral Sea has been steadily shrinking since the 1960s after the rivers that fed it were diverted by Soviet irrigation projects. By 2007, it had declined to 10% of its original size. Satellite images taken by NASA in August 2014 revealed that for the first time in modern history the eastern basin of the Aral Sea had completely dried up and is now called the Aralkum Desert.

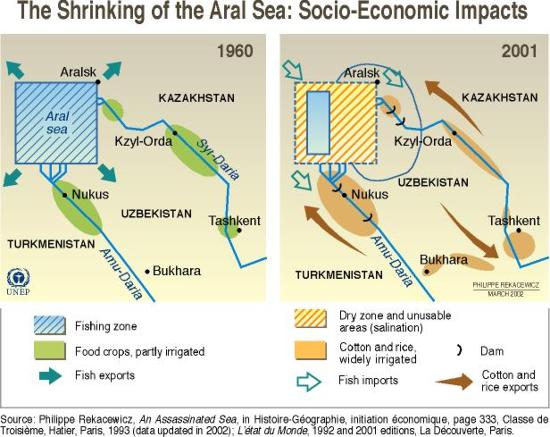
The shrinking of the Aral Sea has been called "one of the planet's worst environmental disasters". The region's once-prosperous fishing industry has been essentially destroyed, bringing unemployment and economic hardship.

The receding sea has left huge plains covered with salt and toxic chemicals [the results of weapons testing, industrial projects, and pesticides and fertilizer runoff] which are picked up and carried away by the wind as toxic dust and spread to the surrounding area. As a result, the land around the Aral Sea is heavily polluted, and the people living in the area are suffering from a lack of fresh water and health problems, including high rates of certain forms of cancer and lung diseases.Vast salt plains exposed by the shrinking Aral have produced dust storms, making regional winters colder and summers hotter.

Owens Lake

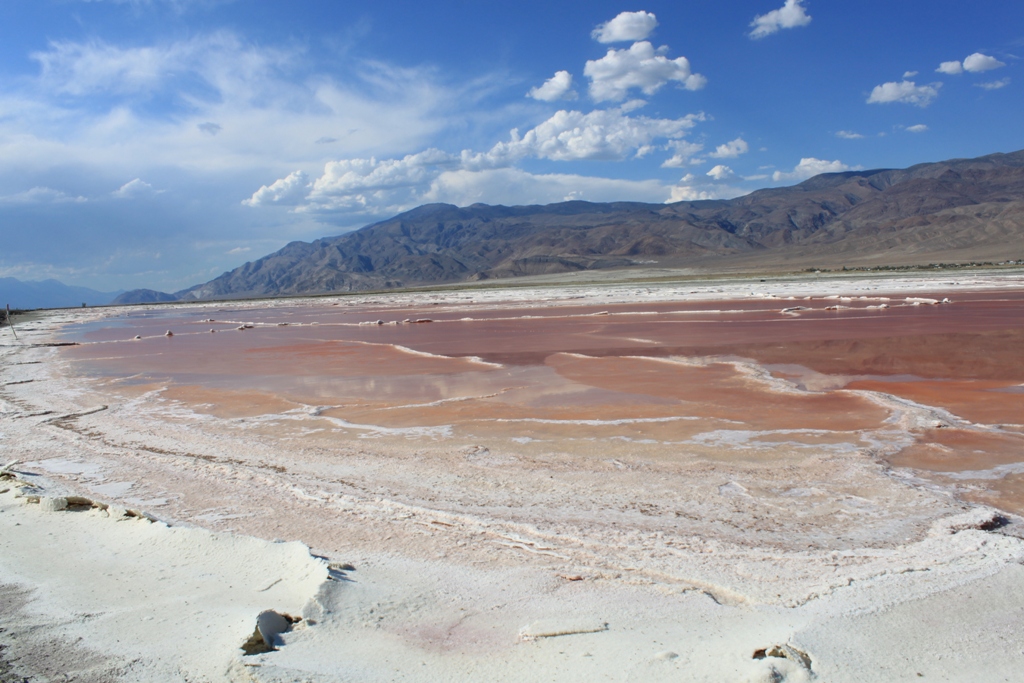
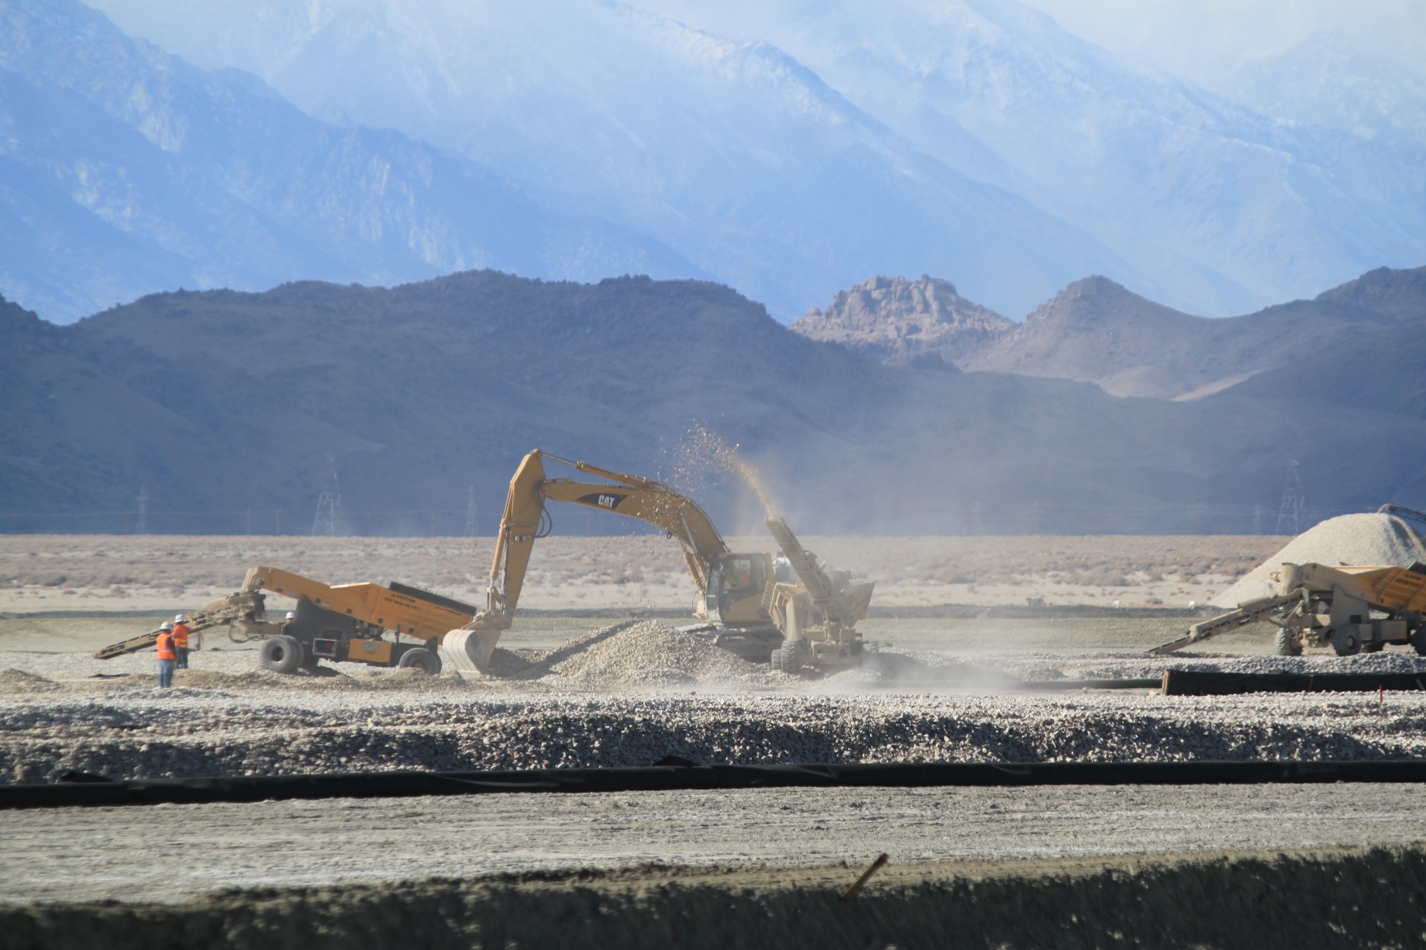
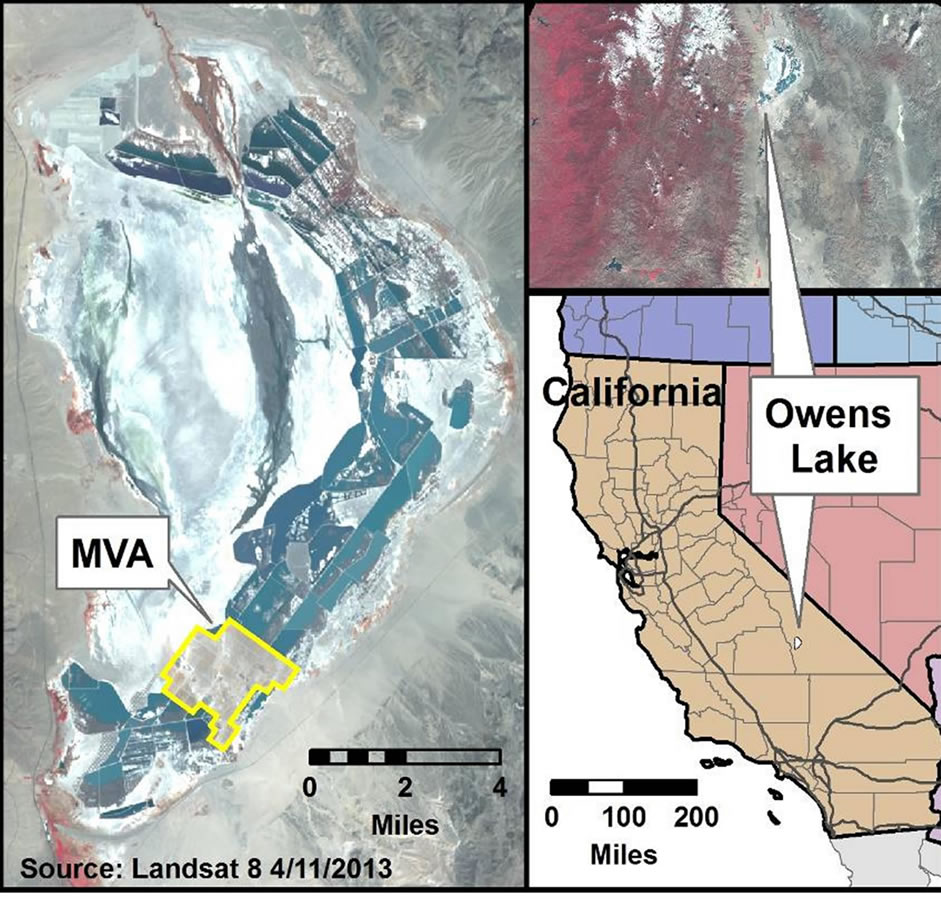
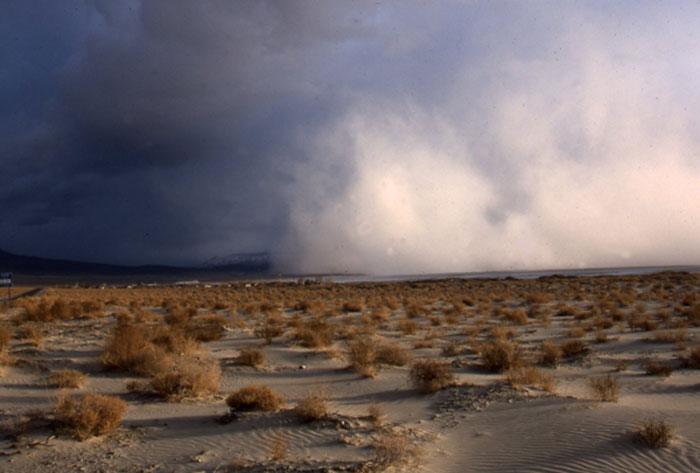
Now just a dry lakebed — a howling wasteland of toxic dust — Lake Owens once held significant water until 1913, when much of the Owens River was diverted into the Los Angeles Aqueduct. This caused Owens Lake to dry up by 1926. Although today, some of the flow of the river has been restored, tragically as of 2013 it is the largest single source of dust pollution in the United States.

Dust Storms

Bales of Hay are scattered in the dry lakebed to help minimize loose dust and dust storms.

Los Angeles Aqueduct

ARTICLES
Owens Lake (Wikipedia) >
Where Chinatown Began >
Flying Over Owens Lake During California’s Drought:
Owens Lake: Past Resent and Future >


List of Drying Lakes (Wikipedia) >


Thursday, October 8, 2015

Black Sea Pollution

Black Sea by Neal Ascherson 
A bit tedious and long-winded, nevertheless this book covers the broad span of 3,000 years and really goes into depth about the myriad of jumbled ethnicities and the reasons behind the never-ending wars in the region. The last chapter really nails the ecological havoc the area is currently facing and is the best read of the whole book.

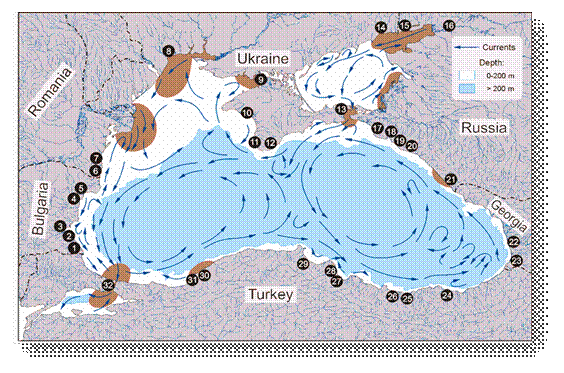
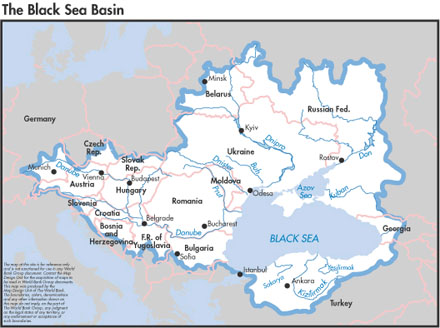
The Black Sea Watershed


Currents and river delta sediment discharge

Ecology

Due to the unique geography and ecosystem of the Black Sea, the current level of water pollution exceeds the ecosystem’s assimilation capability and is in grave danger.

For decades, a uniquely high river discharge into the Black Sea diluted its salinity consequently reducing its biodiversity but ironically simultaneously supplied sea vegetation with unusually high amount of nutrients, providing its fast proliferation and high biomass. 

As detailed in an earlier posting, this in essence created a dead layer of water on the bottom and a thin layer of cleaner but vulnerable life-sustaining water on the surface.


Pollution
The intense pollution by the surrounding countries that has now being going on for many decades has taken a heavy toll on the whole ecosystem. Under the current bad environmental conditions, more than 160 million people in Bulgaria, Ukraine, Russian Federation, Romania and Turkey are exposed to danger.  

Anually more than 100 000 tons of sewage, tens of thousands tons of oil products, tens of thousands tons of toxic heavy metals (copper, lead, cadmium, etc.) enter the sea.

 
 Increased shipping of crude oil has added to the pollution problem
The sea is slowly dying...
Fishing
The combination of pollutants and overfishing has devastated the fishing industry.

Note
Most of the maps and graphics above are Sourced from GRID-Arendal in collaboration with the United Nations Environment Programme (UNEP),  Please visit their site for further Info

Monday, January 5, 2015

The Real Reason U.S. Gas Is So Cheap

American fuel prices are kept down artificially by low gas taxes that fail to address the true social cost of driving. This national refusal to increase gas taxes—which have gone unchanged at the federal level since 1993. Most first-world countries paid at least double what America did then, just as they do today.


This “budget gap” has two enormous impacts on everyday life. The first is that drivers no longer cover the cost of road and bridge maintenance, as the gas tax originally intended.

The far bigger problem is that America's gas taxes are too low to offset what economists call the "externalities" of driving these are the negative social impacts that aren't being compensated for: personal time and work productivity lost to traffic congestion, lives lost to car crashes, health risks created by air pollution, etc.

Article >


Wednesday, October 15, 2014

Electronic Waste - Where Does It Go?

The Global Trade in Electronic Waste

The worldwide flow of electronic waste and hazardous materials

Interactive Map >


Hazardous Waste

Article >

Article >

Article (Stats) >


Tuesday, January 7, 2014

USA Carbon Footprint: Cities vs. Suburbs

Yikes!!  America's urban centers are locked inside vast rings of emissions-spewing suburban sprawl.

According to a new study, population-dense cities contribute less greenhouse-gas emissions per person than other areas of the country, but these cities’ extensive suburbs essentially wipe out the climate benefits. Berkely Article >

Carbon footprints 
Check out the Interactive U.S. Map >


Beefing Up Population Density Won't Curb Greenhouse Gas Emissions

Our suburbs are responsible for 50 percent of America's household emissions – twice as much as their urban counterparts.

City dwellers tend to have smaller carbon footprints than their suburban neighbors. They use more public transportation and live in smaller abodes, whereas folks in the suburbs own more vehicles, have bigger homes, and enjoy larger household incomes. Article >

Wednesday, August 7, 2013

Man-Made Pollution - Visible From Space!


NASA Satellite Spots Foul Pollution Over Shipping Lanes


Nitrogen dioxide is a nasty gas produced largely by internal-combustion engines. This pollutant is rampant throughout the planet, but nowhere moreso than above the heavily trafficked lanes of international shipping vessels.

Monday, April 22, 2013

Toxic Contamination From Natural Gas Wells

Pennsylvania: 
Toxic Contamination From Natural Gas Wells


Flash-based Interactive Map showing data collected from more than 200 natural gas wells. Very Interesting - be sure to interact with the map...


Wednesday, April 3, 2013

The Great Pacific Garbage Patch

The Great Pacific Garbage Patch

Somewhere in the Pacific Ccean is a floating mass trapped by currents. Consisting mainly of plastic, it is almost three times the size of Spain and Portugal combined...


Convection Currents and The Convergence Zone

(The Pacific Gyre)


This article has some wonderful interactive animations


Sunday, March 31, 2013

Our Changing Forests

The world’s forests absorb roughly a quarter of human emissions of carbon dioxide, and help limit the increase of the gas in the atmosphere. 
Many are threatened by a variety of factors...

Saturday, February 23, 2013

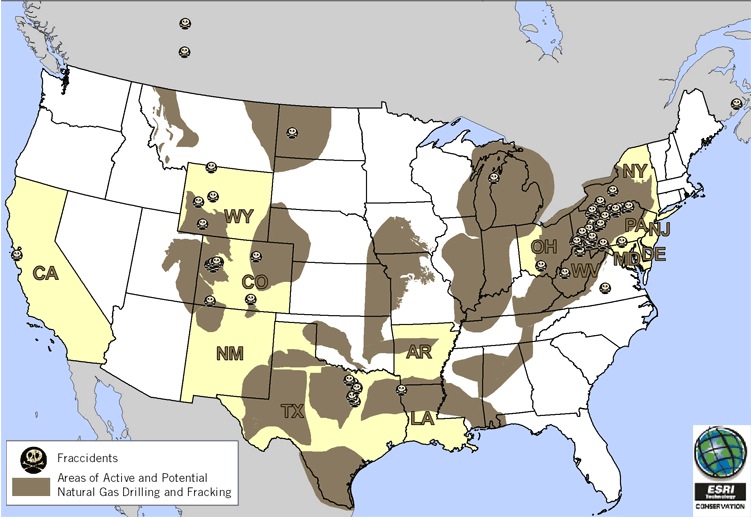
Fraccidents

Fracking Across the United States 


Clean Transportation? The Winner

Emissions from cycling are over 10 times lower than those stemming from the passenger car,"even taking into account the additional dietary intake of a cyclist compared with that of a motorized transport user." Bean eaters on bikes don't worry!  :-)

Saturday, January 26, 2013

Global Carbon Emissions

Bubble Chart - Carbon Emissions

A bubble chart used for maximum effectiveness. Ina millisecond you see that China and the U.S. are the worst offenders. The color scheme easily visually delineates continents without even the need for a key.

Site > http://www.stanfordkaystudio.com/information.html
As you scrolled down, did you notice the overall shape?

This dual infographic just nails it home brilliantly.
http://www.architectsjournal.co.uk/pictures/576x432fitpad[0]/4/2/3/1291423_Untitled.jpg