Welcome
This blog will highlight great infographics available online and discuss both the short and long term aspects of the information explosion.The amount of information that we absorb is often on overload. Did you know that between the birth of the world and 2003, there were five exabytes of information created. "We now create five exabytes every two days (Google CEO Eric Schmidt)."
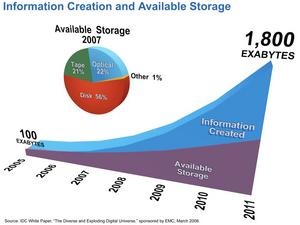
With the rise of the Internet, electronic books, blogs and mobile devices, we’ve never had easier access to an unimaginably vast avalanche of digital information that is increasing exponentially as we speak.
One way to help process this horde of data is through infographics. A good infographic is simple way to visually present info that might otherwise be misunderstood or avoided because it seems too complex. Using symbols, charts and maps; graphic visual representations of data can help us process information quickly and clearly.
Once used predominantly to make maps more approachable, scientific charts less daunting and as key learning tools for children, inforgraphics have now permeated all aspects of our modern world.
What is an Infographic?
Here is a perfect example (an Infographic defining Infographics!)http://visual.ly/what-infographic-2
"A picture is worth a thousand words" a common and easily understood phrase that means a complex idea can be conveyed with just a single still image. It also aptly characterizes one of the main goals of visualization, namely making it possible to absorb large amounts of data quickly.
