Showing posts with label animation. Show all posts

Thursday, February 4, 2016

Decline of U.S. Railroads - Animated Maps

Railroad History has always fascinated me. The two animated maps below vividly illustrate the huge loss of railroad passenger service across America...


Map from the National Association of Railway Passengers 
and Malcolm Kenton via Greater Greater Washington.
Animation by Joss Fong
Slowed Down by Rich Coffey

Article >


Watch: The slow, sad decline of Amtrak
Source: http://media.mnn.com/assets/images/2011/05/amtrak-timeline.gif

Article >


Thursday, April 11, 2013

Saturday, February 16, 2013

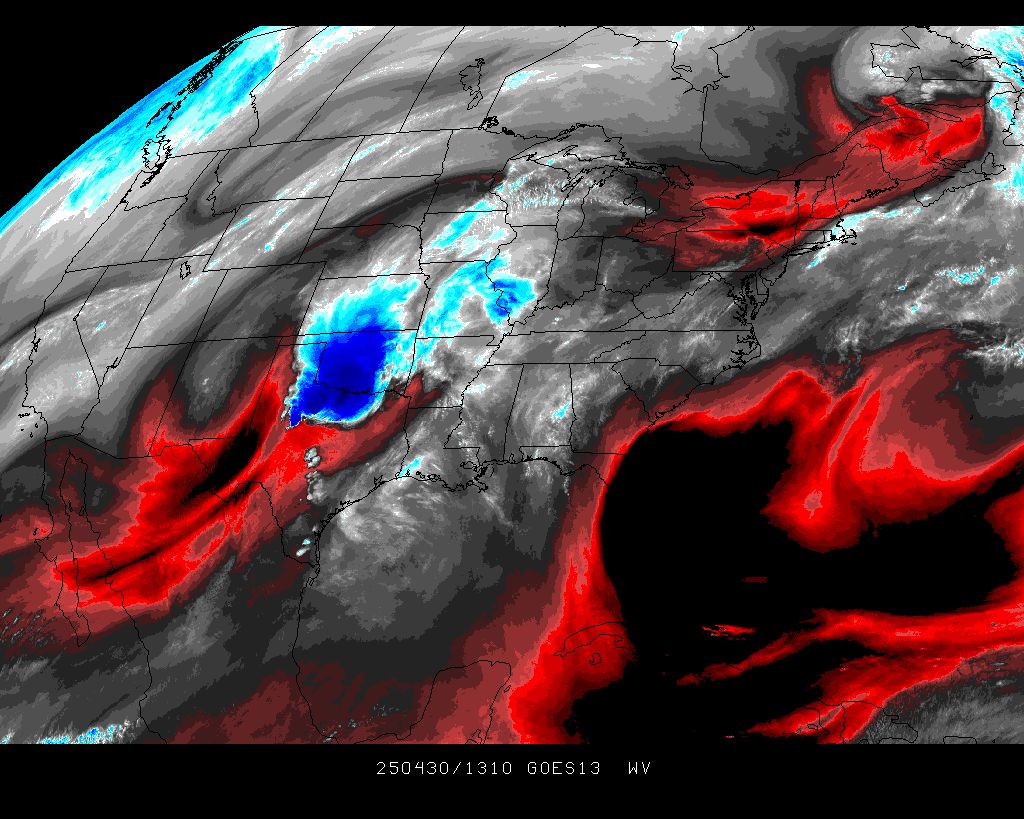
Animated Maps of Water Vapor (Cloud Cover, etc.)


The ability to see Earth from space has forever changed our view of the planet. Now able to look at the Earth as a whole,. we can observe how its atmosphere, oceans, landmasses, and life interact as global systems

Water Vapor (Monitoring Moisture Patterns)

Heat and moisture from the oceans drive atmospheric circulation and weather patterns. Moisture in the atmosphere forms clouds which cover an average of 40% of the Earth at any given time. Clouds are carried through the atmosphere by the wind. The patterns in cloud motion in this time-lapse sequence show how Earth's winds move in bands or zones which define regional wind directions.

The Gulf Stream, etc.


Continental USA


Europe


Pacific Ocean


Tuesday, January 29, 2013

Great Lakes Currents (Animated Map)


Great Lakes Surface Currents Map 
Pretty Amazing animation from data

Surface currents tend to follow the wind direction more closely than currents at depth. Depth-averaged currents represent the average water motion from surface to bottom and tend to follow shoreline and bottom contours. 


Sunday, January 27, 2013

A Company's Evolution Animated


The OrgOrgChart (Organic Organization Chart) project looks at the evolution of a company's structure over time. A snapshot of the Autodesk organizational hierarchy was taken each day between May 2007 and June 2011, a span of 1,498 days.

Each day the entire hierarchy of the company is constructed as a tree with each employee represented by a circle, and a line connecting each employee with his or her manager. Larger circles represent managers with more employees working under them. The tree is then laid out using a force-directed layout algorithm.


Read quick summary and scroll to video
Amazing video - totally mesmerizing...