Saturday, November 21, 2015

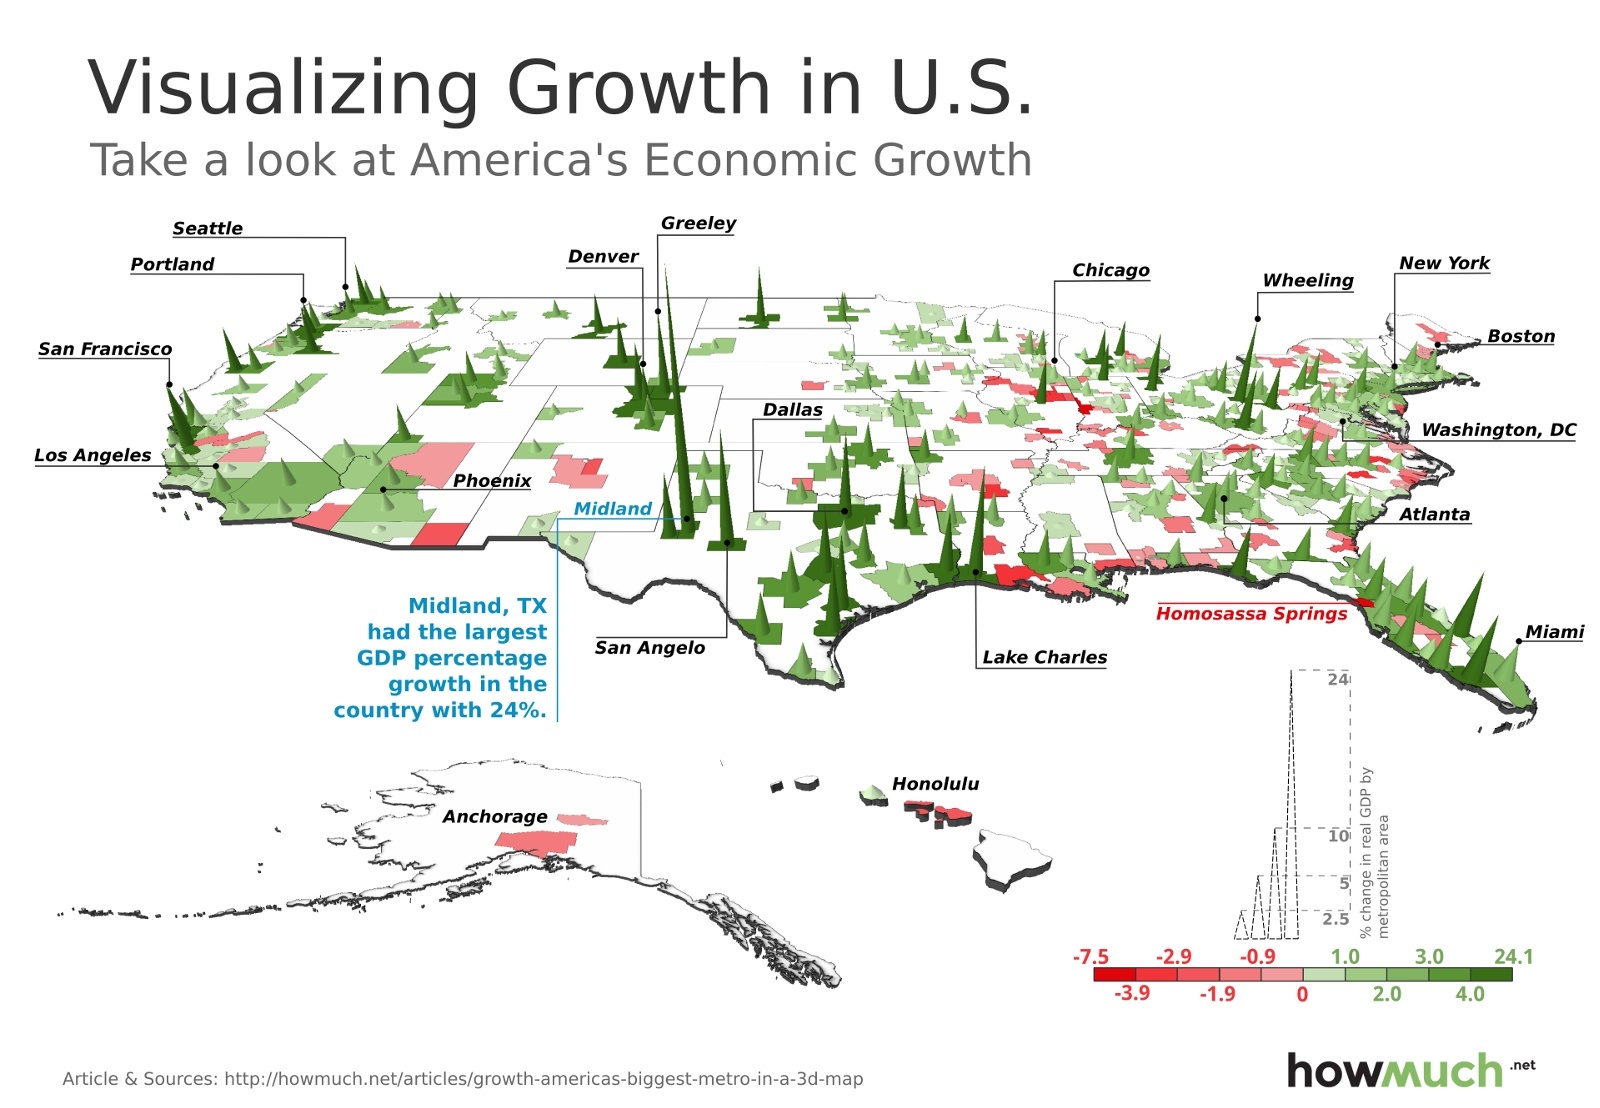
Mapped in 3D - America’s Economic Growth

Where U.S. Metro Economies Are Growing or Shrinking

3D Map

Article >

GDP growth increased 2.3% in 2014 as compared with 1.9% growth in 2013. The industry with the highest growth was professional and business services,

Additional Info on the Map >

Sunday, November 15, 2015

Arab Slave Trade

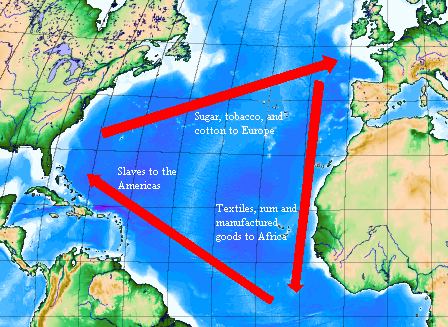
When we think of the enslavement of Africans, most of us connect it with Europeans and the well-known 18th Century triangle of trade:

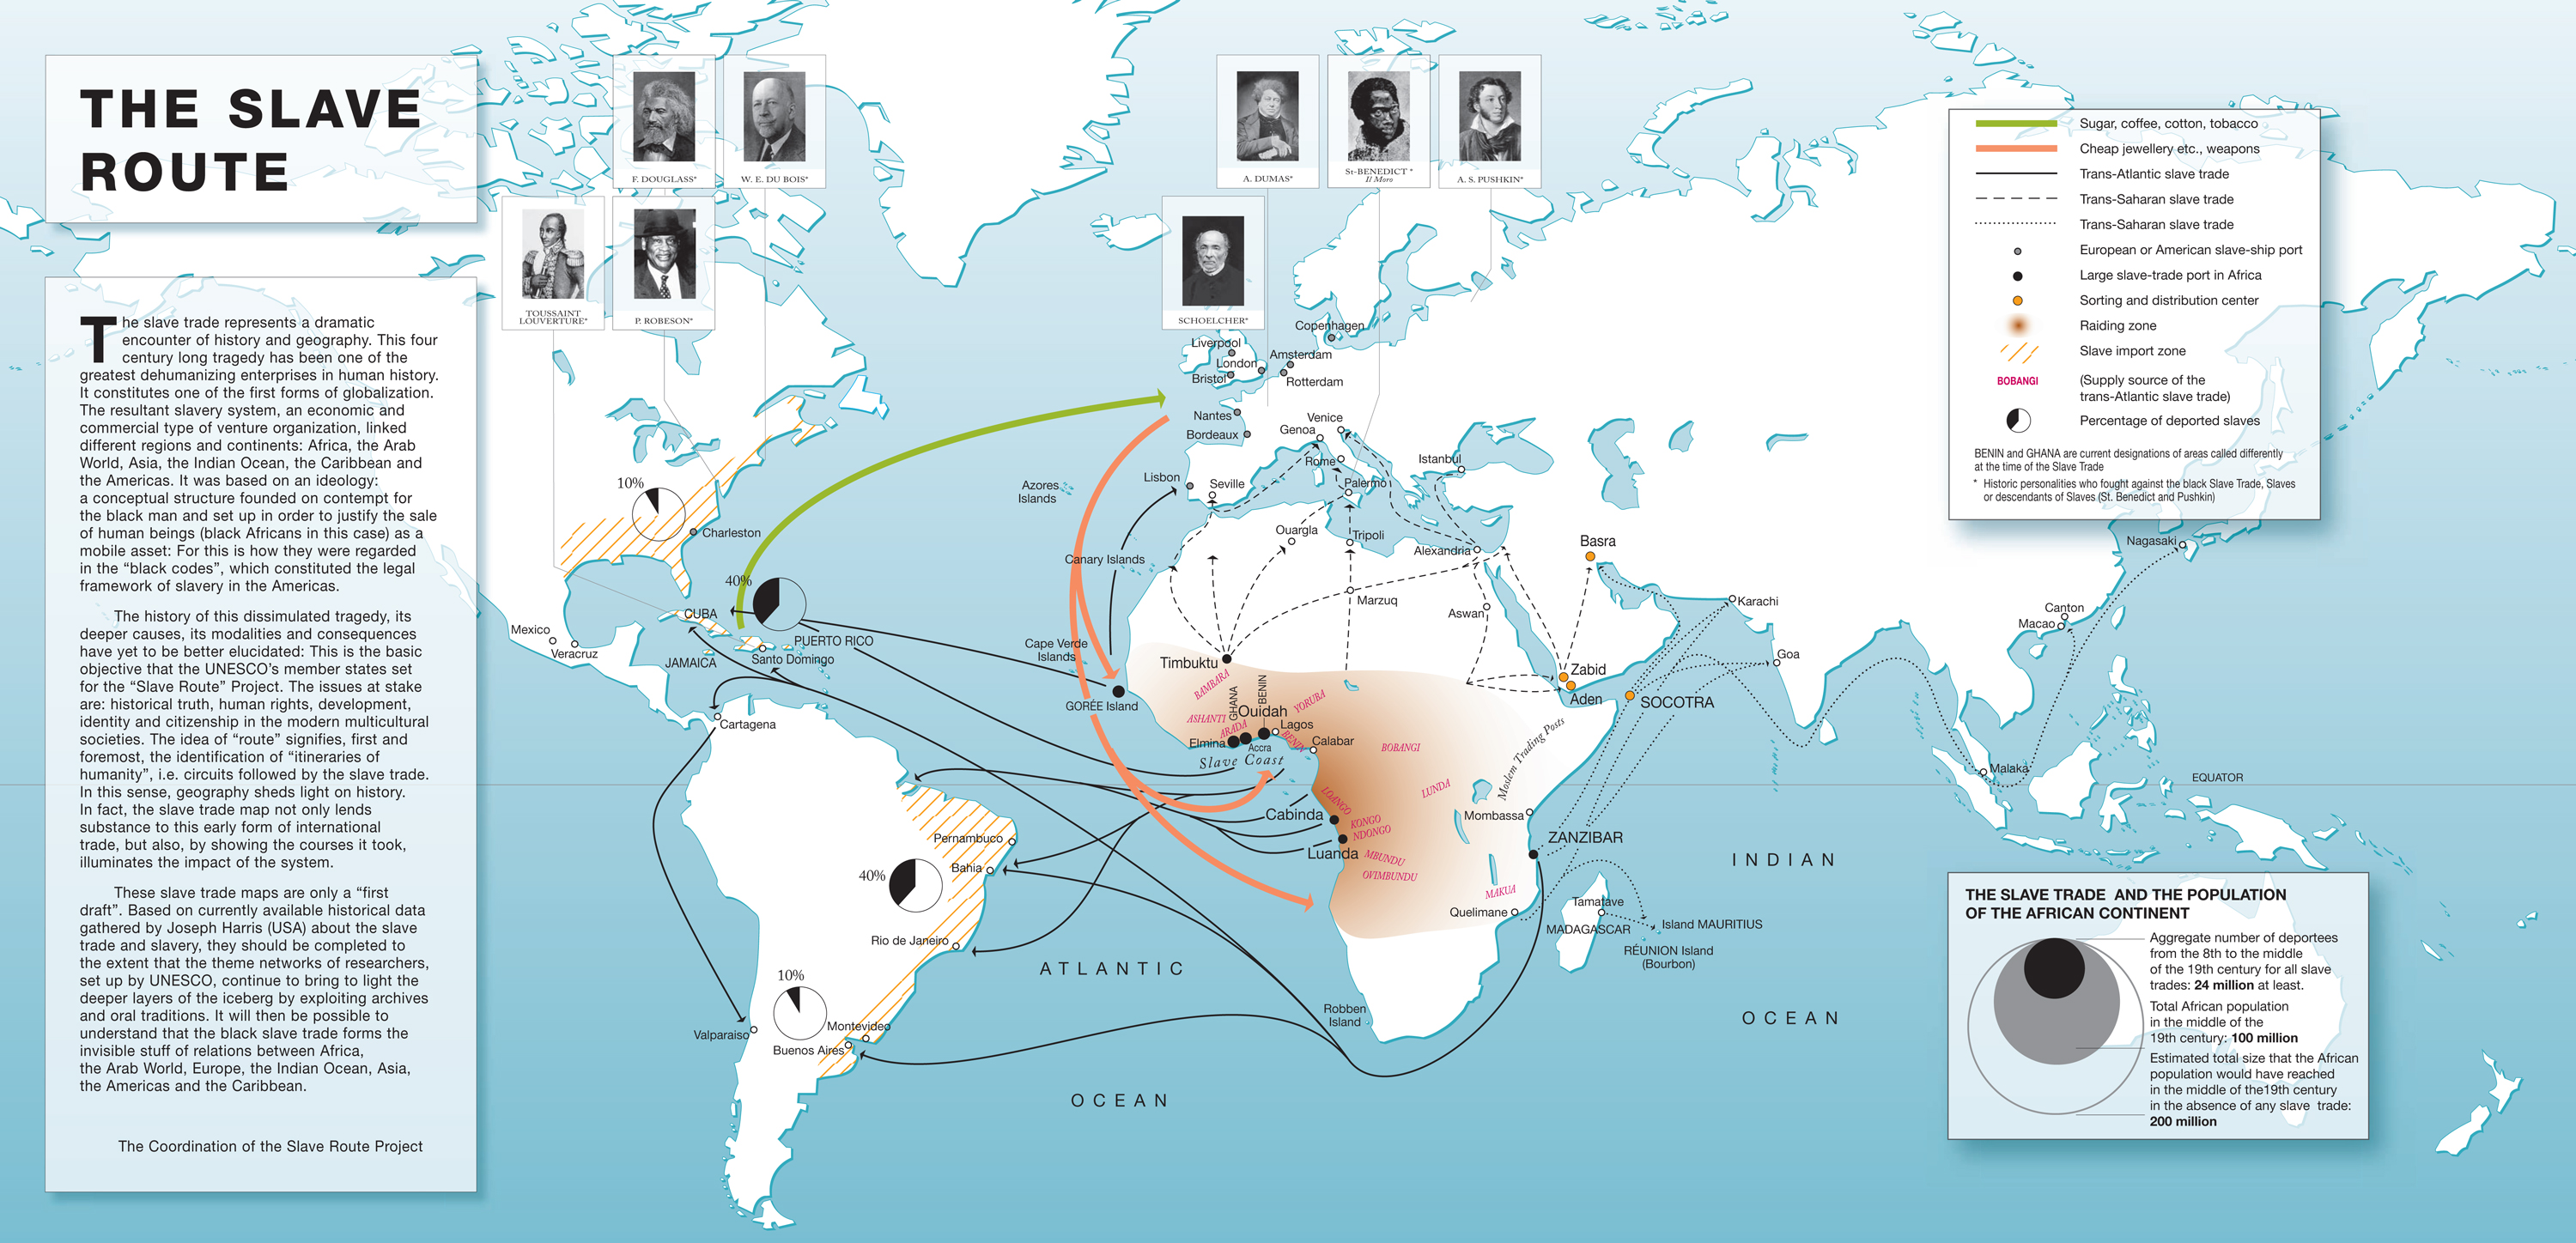
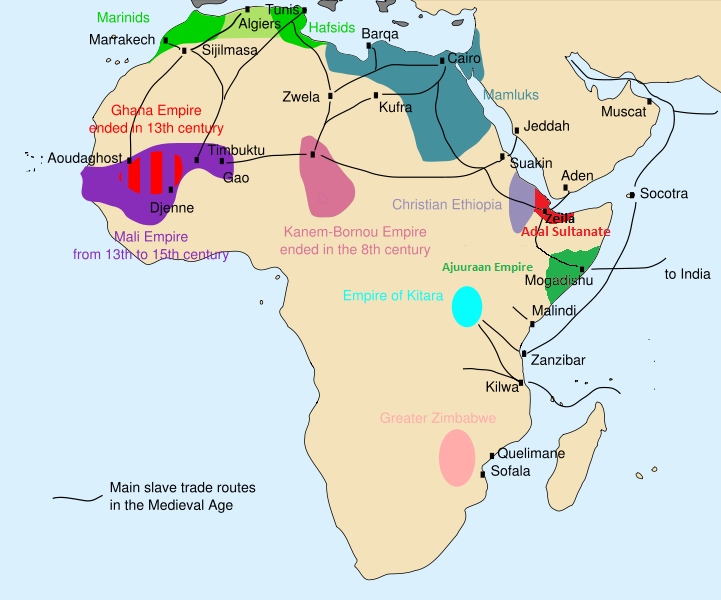
However for over 900 years, Africans were enslaved by Arabic slave traders. The Arab slave trade originated before Islam and historians estimate that between 650 and the 1960s, 10 to 18 million people were enslaved by Arab slave traders. Slaves were taken from Europe, Asia and Africa across the Red Sea, Indian Ocean, and Sahara desert.

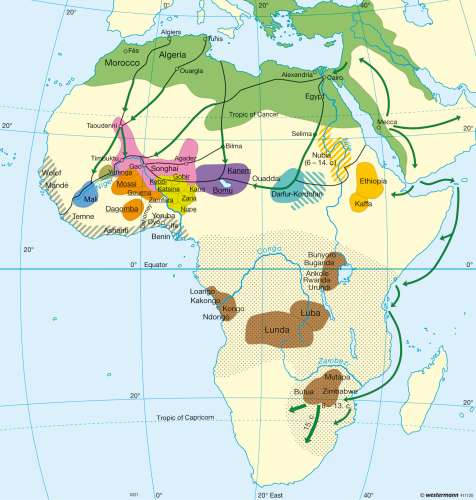
During the ninth century Arab and Swahili traders on the Swahili Coast captured Bantu peoples (Zanj) from the interior in present-day Kenya, Mozambique and Tanzania and brought them to the coast.

Did You Know?
Slavery in the holy city of Mecca would remain until 1966 and in all other Arabic countries until 1990.

Zanj Rebellion

A series of slave uprisings known as the Zanj Rebellion took place between 869 and 883 AD near the city of Basra situated in present-day Iraq. The rebellion grew to involve over 500,000 slaves and free men who were imported from across the Muslim empire and claimed over "tens of thousands of lives in lower Iraq. The Zanj who were taken as slaves to the Middle East were often used in strenuous agricultural work.

Barbary Slave Trade

Arabs also enslaved Europeans. Between 1 million and 1.25 million Europeans were captured between the 16th and 19th centuries by Barbary corsairs, who were vassals of the Ottoman Empire, and sold as slaves. These slaves were captured mainly from seaside villages from Italy, Spain, Portugal and also from more distant places like France or England, the Netherlands, Ireland and even Iceland.

Often referred to as the Barbary slave trade, Barbary pirates raided ships and  and coastal towns and men, women, and children were captured to such a devastating extent that vast numbers of sea coast towns were abandoned. Professor Robert Davis estimates that--from the beginning of the 16th century to the middle of the 18th--1 million to 1.25 million white Christian Europeans were enslaved in North Africa.

Once the New World was "discovered" and settled by white Europeans, the demographics changed. As Native Americans were wiped out and/or driven to extinction (as in the Caribbean islands), European colonists turned to Africa for slave laborers on the sugar and cotton plantations.
Tuesday, November 10, 2015

1924 Rand McNally New York State Map

Awesome maps showing New York State railroads, interurbans and canal lines in 1924.
Great site - tons of material!

David Rumsey Historical Map Collection

Connecticut Railroad Valuation Maps

The University of Connecticut (uConn) and the Connecticut State Data Center (CTSDC) have done a wonderful job of providing access to a large series of 1915 New York, New Haven and Hartford Railroad Valuation Maps.

The Google-Driven interactive map to navigate through this series is truly a work of art!

I have colorized a few map selections of locations I am somewhat familiar with (and partial too :-) ). Click on any image to enlarge.

Trumbull - Along the Rail Trail

The Dam near the Tait's Mill Ruins
Ice House and Trumbull Pond 
Long Hill Station 

 Springdale, CT

There once was a station at the cemetery!

Springdale Station and Industrial Spurs

Newtown-Southbury


Echo Valley Road near Cavanaugh Pond


Pomperaug River Railroad Bridge - Southbury

Tuesday, October 27, 2015

The Flow Towards Europe

Mapping the Frenzy of Europe's Migrant Crisis

The sheer scale of this migrant crisis has rocked the world and left European Union leaders grappling for solutions.

Only a small fraction of refugees fleeing their homes make it to Europe. The UN has registered four million Syrian refugees in Turkey, Lebanon, Jordan, Iraq, Egypt and North Africa. Most of them live in refugee camps close to the border. They would fit on 59 soccer fields.

Stats

  • Greece reported roughly 10,000 asylum-seekers a day arriving from Turkey. 
  • Around 680,400 people arrived in Europe just this year from crisis regions.
  • By the end of  015, Germany, Austria, Hungary, Sweden, the Netherlands, and Finland expect a total of 1.3 million asylum applications.
  • Syria has overtaken all other countries in refugee volume.

Article >

Amazing interactive motion map shows flows of refugees seeking asylum 

Interactive Map >

Each dot represents 25 to 50 people, depending on the device you use


Friday, October 16, 2015

Polynesia - Visual Quick Study

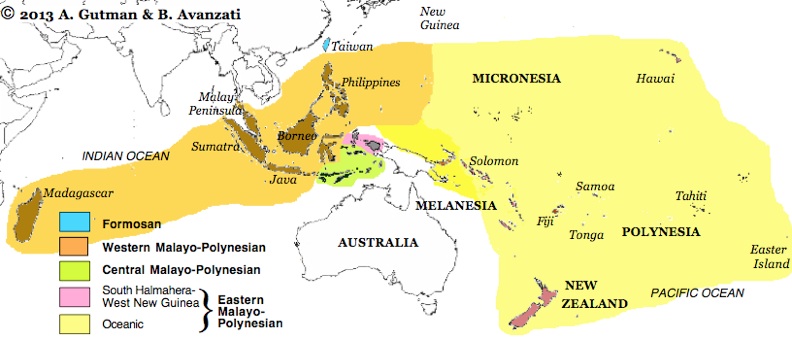
About 4,000 years ago, Austronesian speakers migrated eastward from the Asian mainland to in the area referred to as Near or Western Oceania. The subsequent expansion of these Austronesians into Eastern Oceania began around 1200 BC and led to the colonization of the islands in the eastern Pacific Ocean. This expansion ended with the settlement and colonization of New Zealand around 1250 AD.

Melanesia, Polynesia and Micronesia

Polynesian Migration Maps


Article: 
 ^This is a great site ^


Pacific Currents


Austronesian Language


Thursday, October 8, 2015

Black Sea Pollution

Black Sea by Neal Ascherson 
A bit tedious and long-winded, nevertheless this book covers the broad span of 3,000 years and really goes into depth about the myriad of jumbled ethnicities and the reasons behind the never-ending wars in the region. The last chapter really nails the ecological havoc the area is currently facing and is the best read of the whole book.

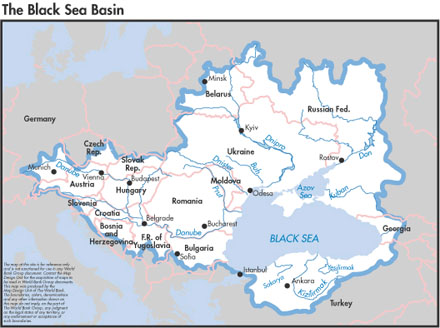
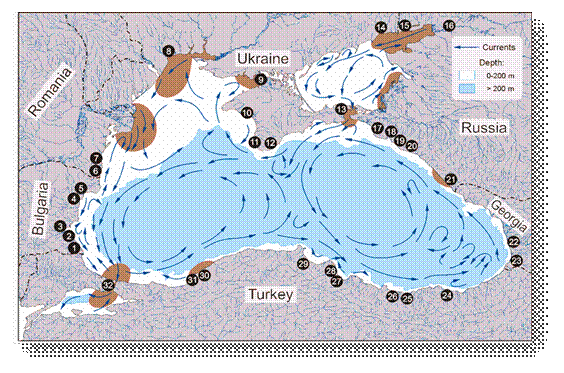
The Black Sea Watershed


Currents and river delta sediment discharge

Ecology

Due to the unique geography and ecosystem of the Black Sea, the current level of water pollution exceeds the ecosystem’s assimilation capability and is in grave danger.

For decades, a uniquely high river discharge into the Black Sea diluted its salinity consequently reducing its biodiversity but ironically simultaneously supplied sea vegetation with unusually high amount of nutrients, providing its fast proliferation and high biomass. 

As detailed in an earlier posting, this in essence created a dead layer of water on the bottom and a thin layer of cleaner but vulnerable life-sustaining water on the surface.


Pollution
The intense pollution by the surrounding countries that has now being going on for many decades has taken a heavy toll on the whole ecosystem. Under the current bad environmental conditions, more than 160 million people in Bulgaria, Ukraine, Russian Federation, Romania and Turkey are exposed to danger.  

Anually more than 100 000 tons of sewage, tens of thousands tons of oil products, tens of thousands tons of toxic heavy metals (copper, lead, cadmium, etc.) enter the sea.

 
 Increased shipping of crude oil has added to the pollution problem
The sea is slowly dying...
Fishing
The combination of pollutants and overfishing has devastated the fishing industry.

Note
Most of the maps and graphics above are Sourced from GRID-Arendal in collaboration with the United Nations Environment Programme (UNEP),  Please visit their site for further Info